

s01e04: When Heap Fragmentation Defeats Organization
📺 Memory Fragmentation: The Large Object Heap Problem

♨ The Pineapple Glitch
Comic ‣ Deep-Dive ‣ Real Failures ‣ Takeaways ‣ Downloads
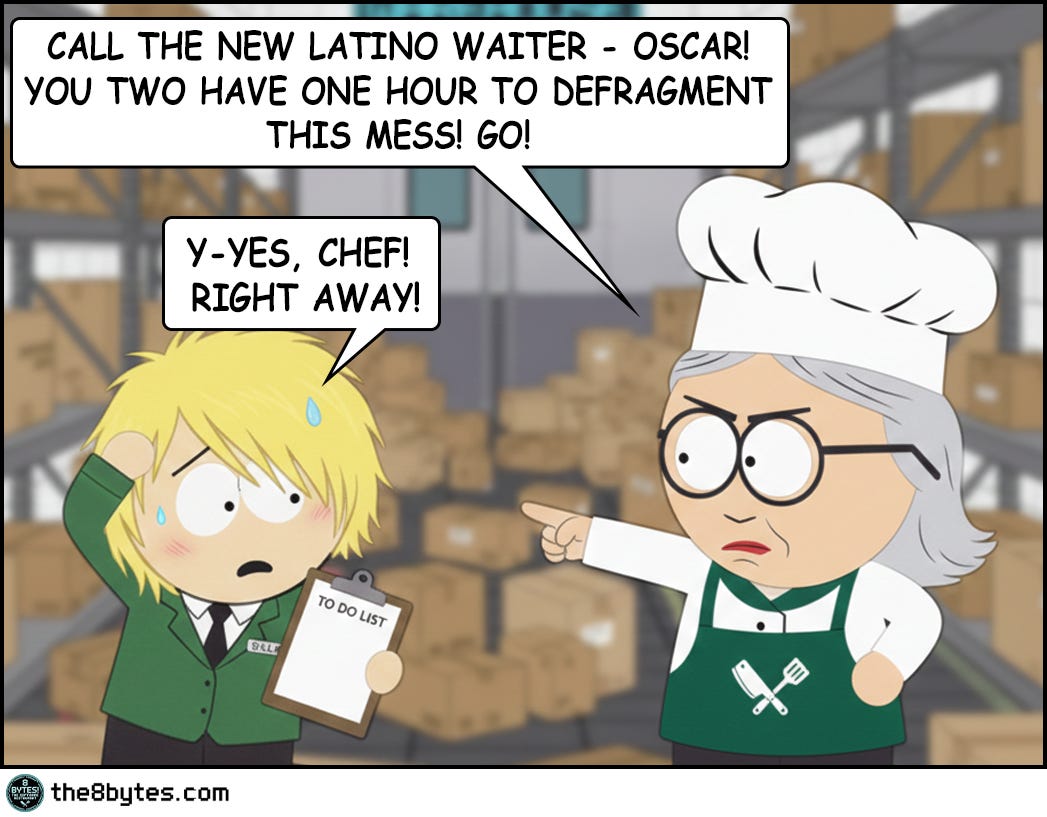
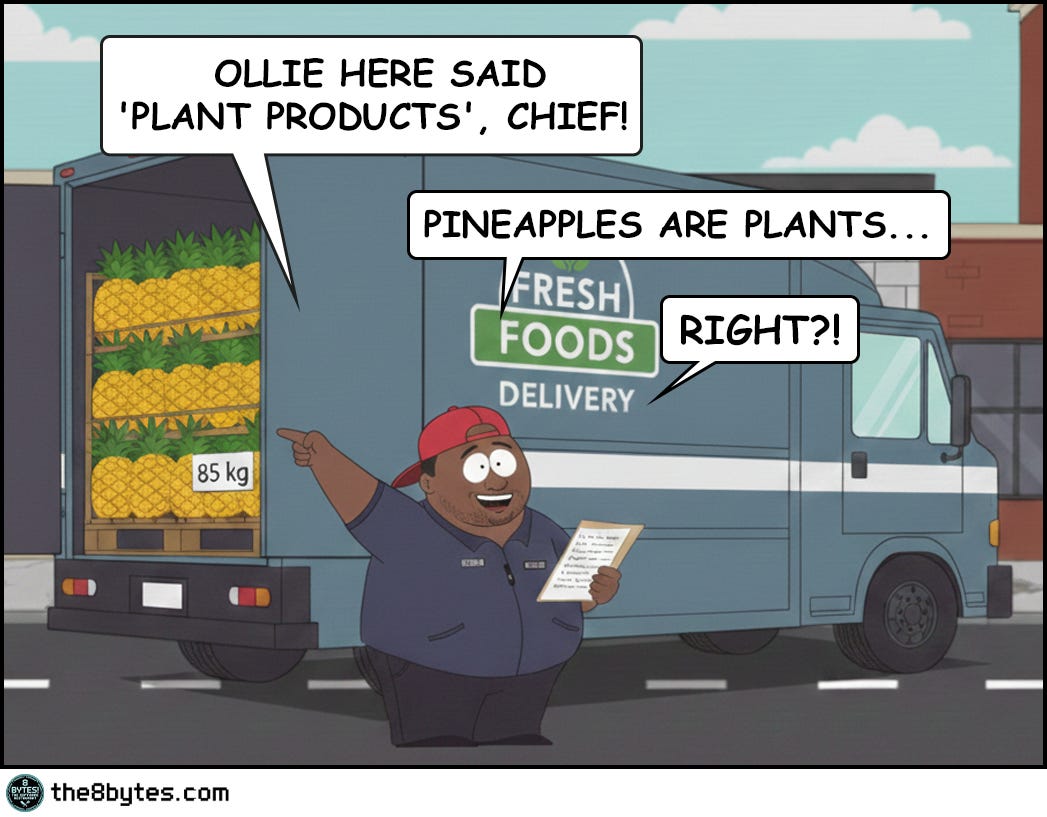
Cody, bartender at 8 bytes! The Software Restaurant: “I’ve learned that in this restaurant, organization isn’t enough. You can have everything perfectly sorted, labeled, and arranged... and still run out of space.
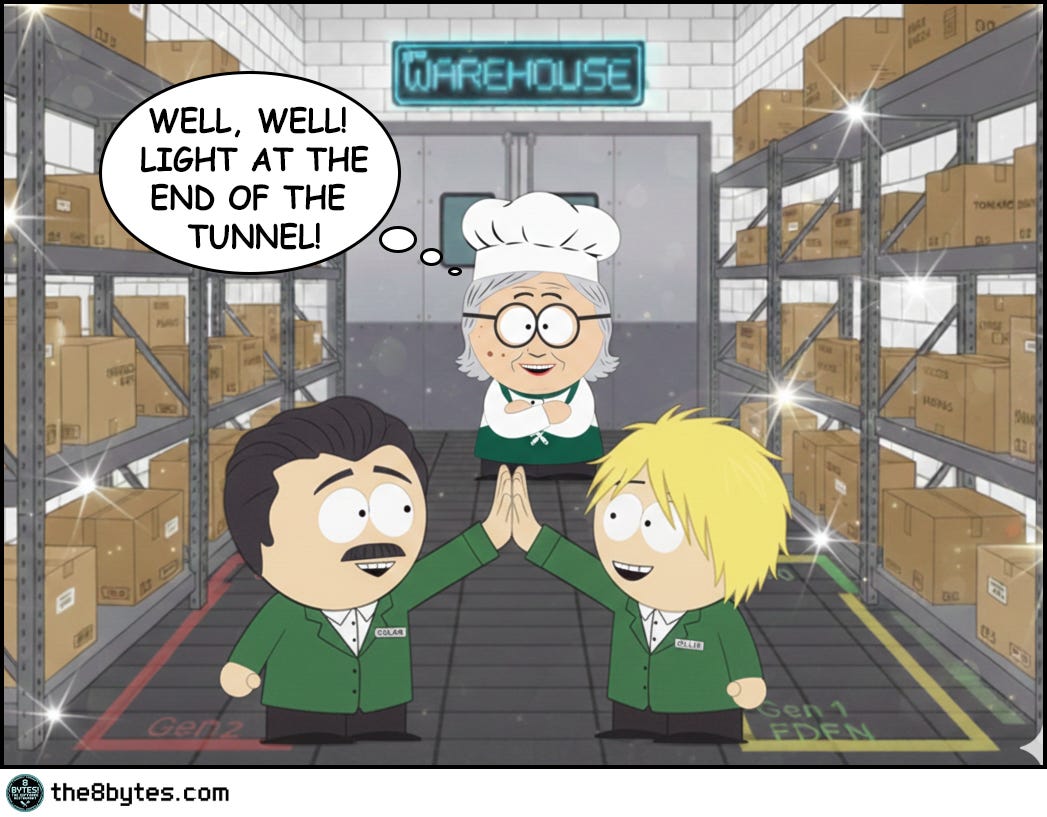
That morning, Julia walked into the warehouse expecting order. What she found was chaos - boxes scattered everywhere, gaps between deliveries, wasted space in every corner. She was furious.
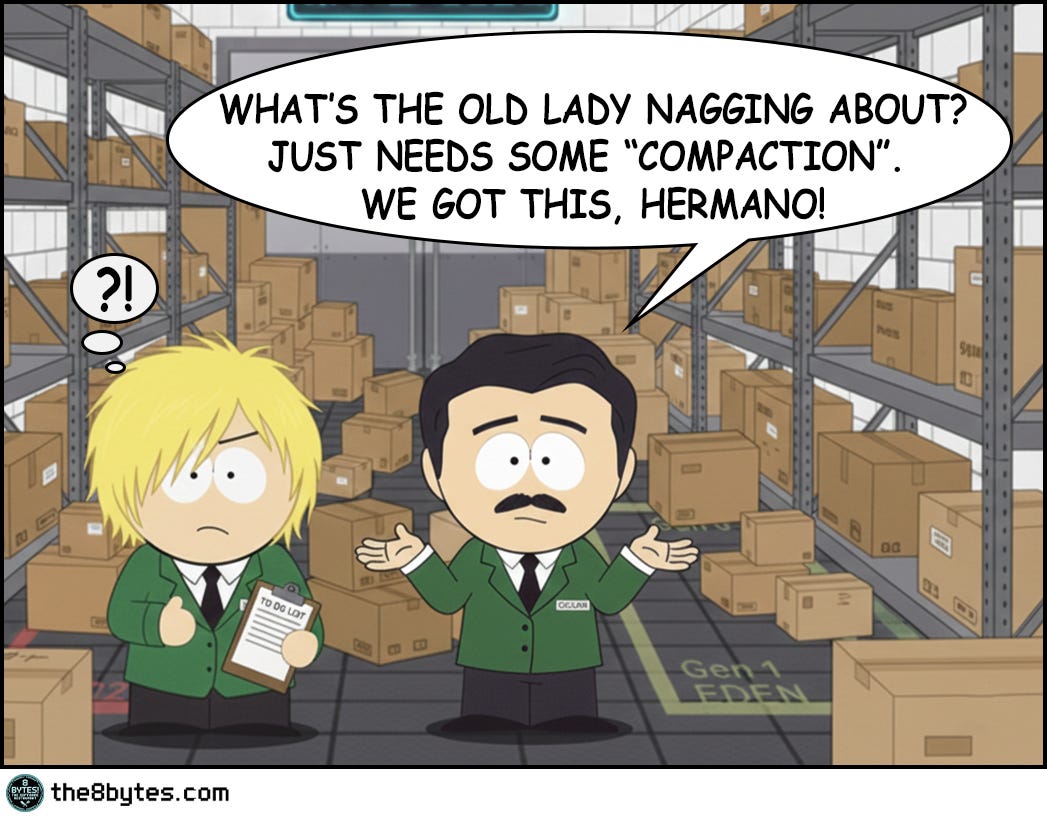
So she did what any good manager would do - she assigned the waiters to organize it. Generation by generation. Fresh produce up front, refrigerated items in the middle, frozen goods in the back. By afternoon, it looked perfect.
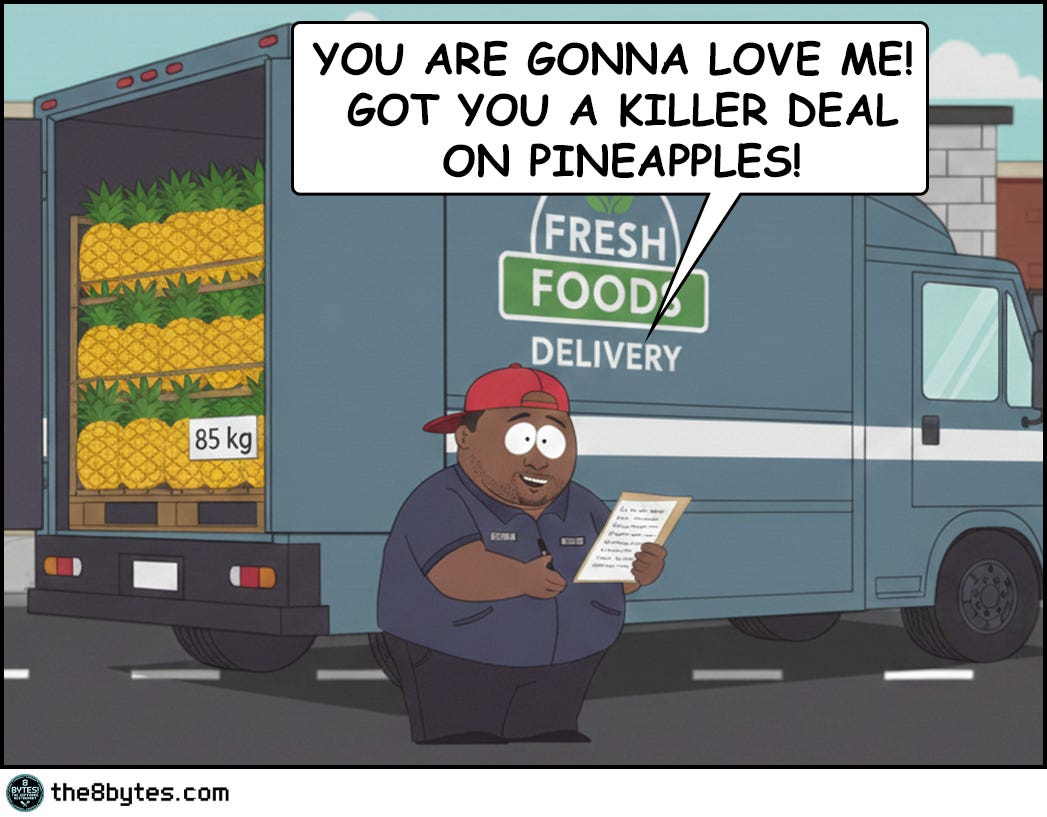
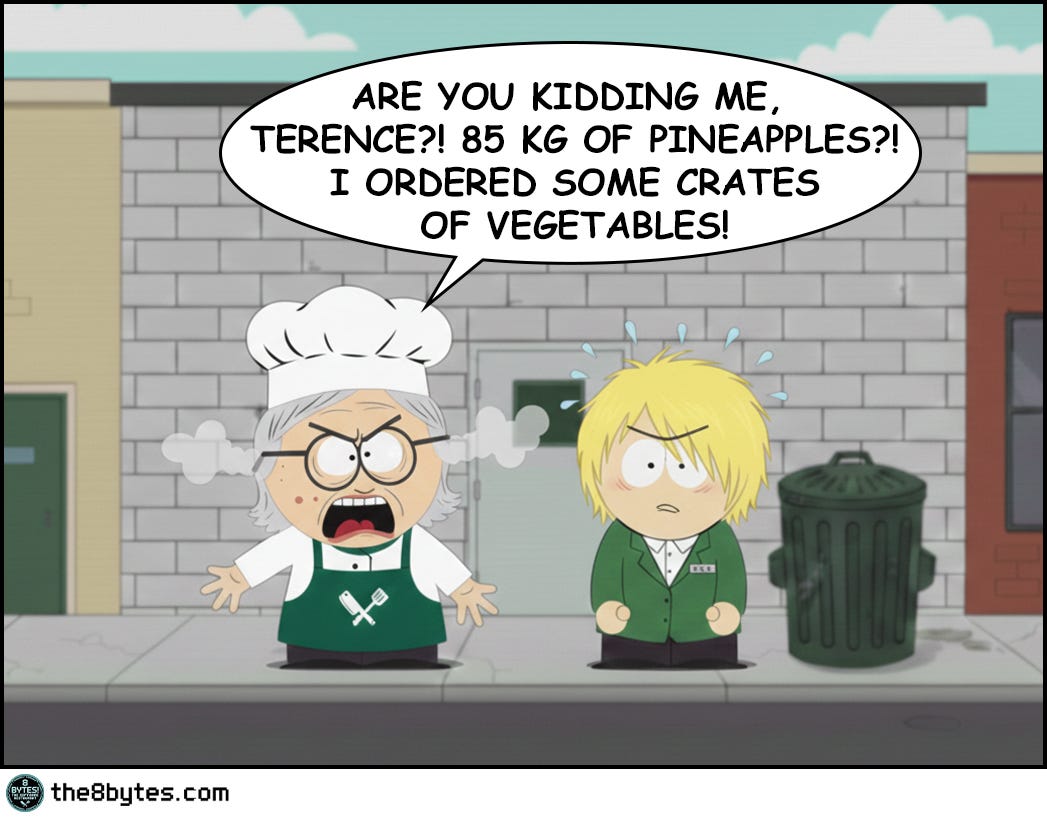
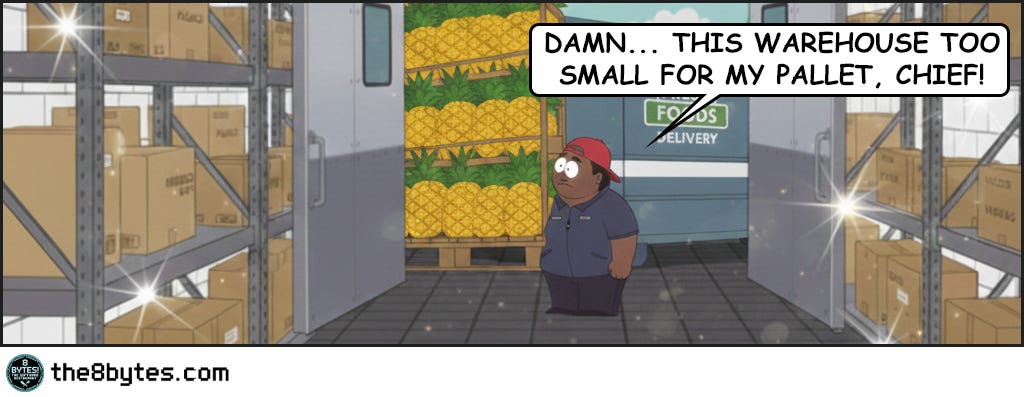
And that’s when Big T, our delivery guy, showed up with a massive truck…
But let’s start from the beginning...
It was early morning when Julia opened that warehouse door...”


Steal These Now (Before Going Deep)
For Engineers: Monitor LOH fragmentation NOW. In .NET check GC.GetGCMemoryInfo().FragmentedBytes. In Java track humongous allocations via JMX. If you see OutOfMemoryException with >30% free heap, you have a pineapple problem.
🡆 More for you? Deep Dive section awaits below.
For Tech Leads: When reviewing memory-intensive code, ask: “Are we allocating large objects repeatedly?” Arrays >85KB, buffers >1MB, images, video frames - these need object pooling or native allocation. Visual Studio 2012 learned this the hard way on launch day.
🡆 More for you? Design Review Questions in the middle.
For Managers: When the CTO says “heap fragmentation despite available memory,” translate: “We have 105 parking spaces across three lots, but the bus needs 85 continuous spaces. Total space exists, but it’s scattered. We need to pool our buses or redesign the parking.”
🡆 More for you? CEO Recipe near the end.
(The 85kg pineapple pallet explains why total space ≠ usable space...)
What Just Happened in Julia’s Warehouse?
The warehouse was perfectly organized. Every box in its proper generation zone, no wasted space, textbook memory compaction.
Then Big T arrived with 85 kilos of pineapples. One massive pallet that won’t fit anywhere, despite 105kg of free space scattered across the zones.
The Pineapple Glitch. Even perfect defragmentation can’t handle it.
Welcome to Episode 4 of Season 1 “Memory Management”
8 episodes exploring Stack, Heap, Garbage Collection, Memory Leaks and other hilarious software disasters. New episodes drop bi-weekly:
✅ E01: Stack Overflow & Recursion → [Read now]
✅ E02: LIFO vs FIFO Starvation → [Read now]
✅ E03: Cache & Stale Data → [Read now]
✅ E04: Heap Fragmentation / GC / LOH → You are here
✅ E05: Garbage Collection - “Stop the World” → [Read now]
⏳ E06: Memory Leaks (drops Mar 05)
📅 E07: Race Conditions (drops Mar 19)
📅 E08: Deadlocks (drops Apr 02)
Deep Dive: Why Did The Perfect Organization Fail?
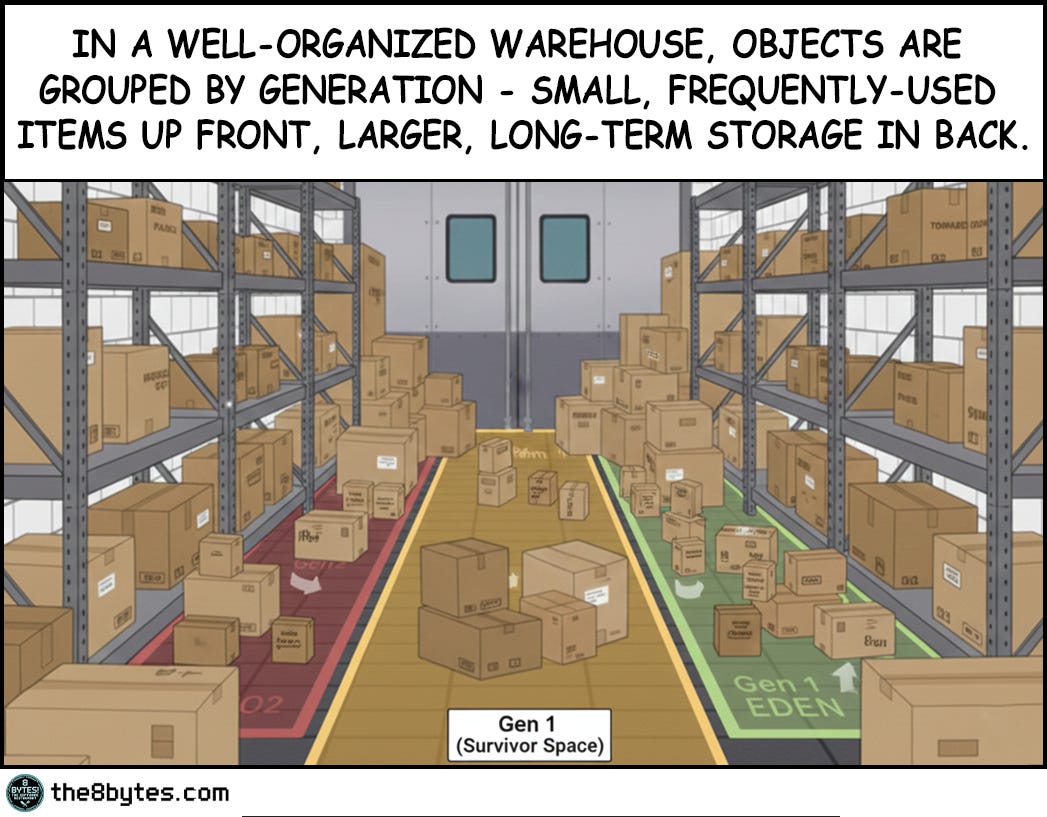
Let’s replay what Ollie and Oscar did. They organized every single box by generation. Small frequently-used items up front in Generation 0. Medium-lived objects in Generation 1. Long-term storage in Generation 2. They eliminated gaps within each zone, creating a perfectly compacted heap. By any measure, they did everything right.
And yet when the 85kg pineapple pallet arrived, it wouldn’t fit anywhere. Not in Gen 0 where they had 20kg free. Not in Gen 1 with its 35kg of space. Not even in Gen 2 with 50kg available. The math seemed simple enough - 20 plus 35 plus 50 equals 105 kilograms of free space, and the pallet only needed 85. But memory allocation doesn’t work like a spreadsheet. It works like a warehouse.
The problem isn’t the total amount of free space. The problem is that the pallet needs 85 contiguous kilograms in one place, and the largest single chunk available is only 50kg. You can’t split a pallet across three different zones any more than you can park a bus across three separate parking lots. This is fragmentation, and it’s one of the oldest problems in computer science.
The Parking Lot Analogy
Your CEO will ask you why the application crashed with an OutOfMemoryException when the monitoring dashboard clearly showed 2GB of free memory. Here’s what you tell them.
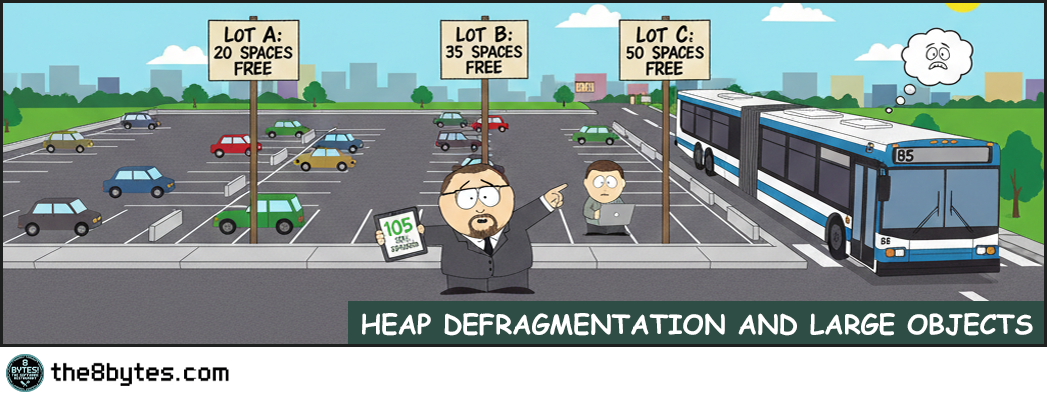
Imagine you manage three parking lots. Lot A has 20 empty spaces. Lot B has 35 empty spaces. Lot C has 50 empty spaces. That’s 105 empty spaces total, which sounds great until a bus shows up needing 85 continuous spaces to park. Can the bus park? No, because even though you have 105 spaces total, your largest contiguous block is only 50 spaces. The bus can’t split itself across three parking lots. Neither can a large object split itself across memory zones.
This is external fragmentation, and every garbage-collected language deals with it differently. Some try to prevent it entirely through aggressive compaction. Others accept it as a trade-off for better performance. Understanding how your platform handles this will save you from the 3am production incident where the server runs out of memory despite having plenty free.
How Garbage Collectors Actually Work
Think about how Julia organizes ingredients at 8 bytes! Restaurant. Fresh tomatoes, peppers, and herbs arrive every morning from the market. She uses them immediately - in salads, garnishes, the daily specials. By evening, they’re almost all gone. The few that remain fresh get moved to the refrigerator. This is Generation 0 - small, frequently-arriving items that get consumed quickly. Most objects in your application are like this. They’re created, used once or twice, and become garbage within milliseconds.
Then there’s the refrigerator storage. Cheese, olives, fresh meat cuts. These last a few days, not just hours. Julia checks them regularly, and if they’re still good after a week, they might move to deeper storage. But most get used within a few days. This is Generation 1 - the middle ground. Objects that survived their first collection but haven’t proven they’ll stick around forever. Request-scoped objects, temporary caches, short-lived data structures.
Finally, there’s the deep storage warehouse. Canned tomatoes, bottled olive oil, frozen meat. These arrive once and stay for months. They’re heavy - moving them around is expensive. Julia might reorganize the warehouse once a season, but no more often than that. This is Generation 2 - long-lived objects. Configuration data, static caches, singleton instances. They’ve survived multiple collections and are likely to stay for the application’s lifetime.
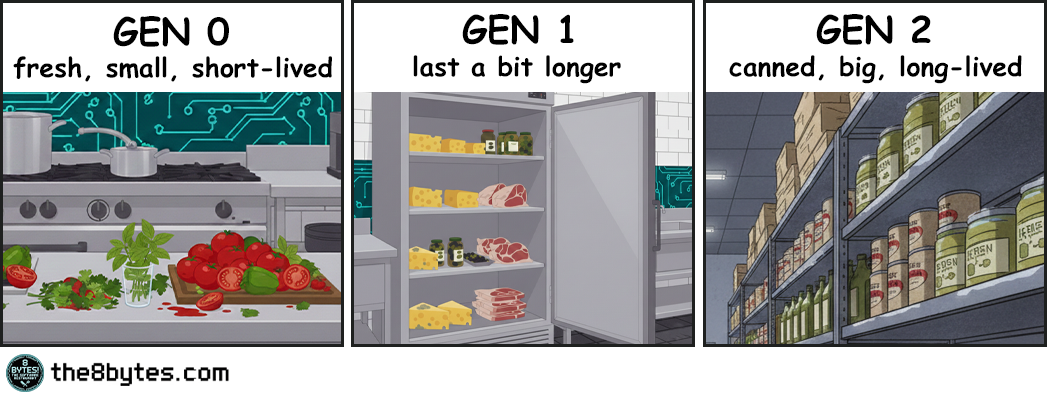
Modern garbage collectors in both Java and .NET use exactly this pattern. They divide memory into generations based on object age. The young generation gets collected frequently because that’s where most garbage accumulates - just like fresh produce that spoils quickly. The old generation gets collected rarely because moving those large, long-lived objects is expensive - just like reorganizing the entire frozen storage warehouse.
This generational hypothesis turns out to be true for most applications. Walk through any codebase and you’ll see it. Temporary variables live for milliseconds. Request objects die when the request completes. Short-lived objects vastly outnumber long-lived ones. By focusing collection work on the young generation where most objects die, garbage collectors keep overhead low even in applications with high allocation rates.
Compaction: The Secret Weapon Against Fragmentation
But organizing ingredients by freshness isn’t enough. You also need to keep each storage area tidy, or you end up with the chaos we saw when Julia first opened the warehouse door at the beginning of our story.
Picture what happens after a busy lunch service. The fresh produce area has gaps where tomatoes were used. The refrigerator has empty spaces where cheese was taken. The warehouse has holes where someone grabbed canned goods. If you leave it like this, eventually you can’t fit new deliveries even though plenty of total space exists. The space is fragmented into unusable pieces.
This is where compaction comes into play.
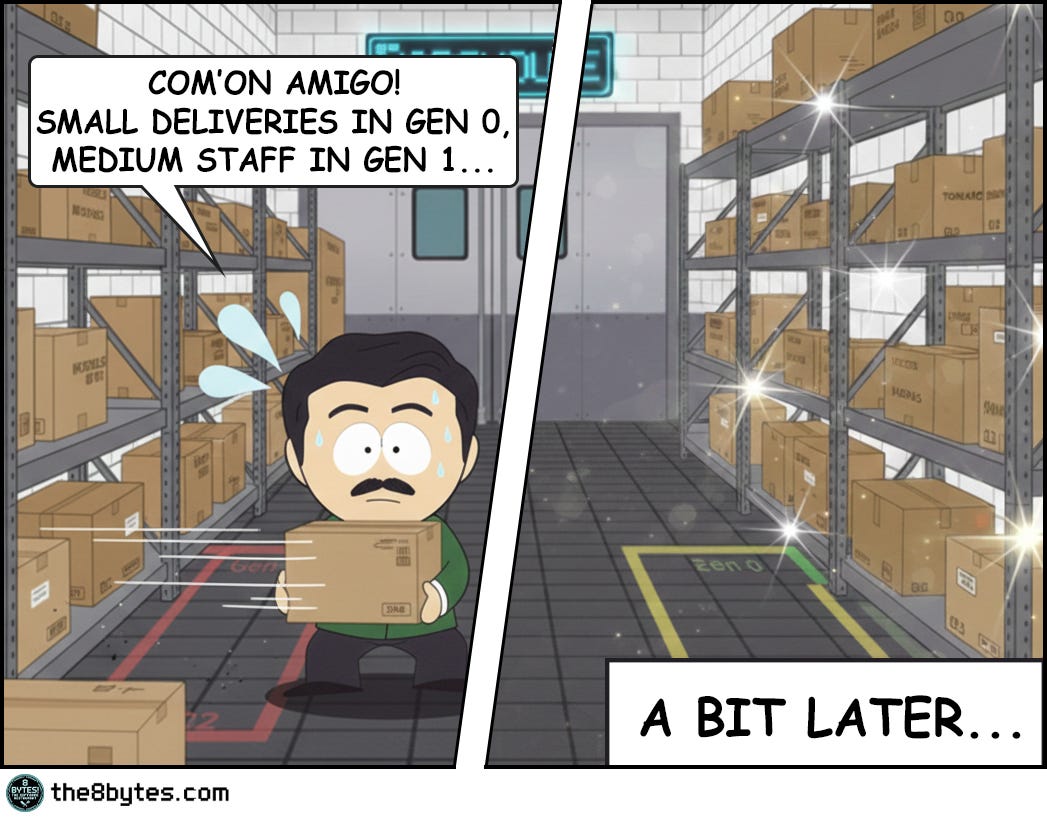
At the end of the day, Ollie and Oscar reorganize. They push all the remaining fresh produce together, eliminating gaps. They consolidate the refrigerator items. They reorganize the warehouse shelves. Now all the free space is in one contiguous block at the end, ready for tomorrow’s deliveries.
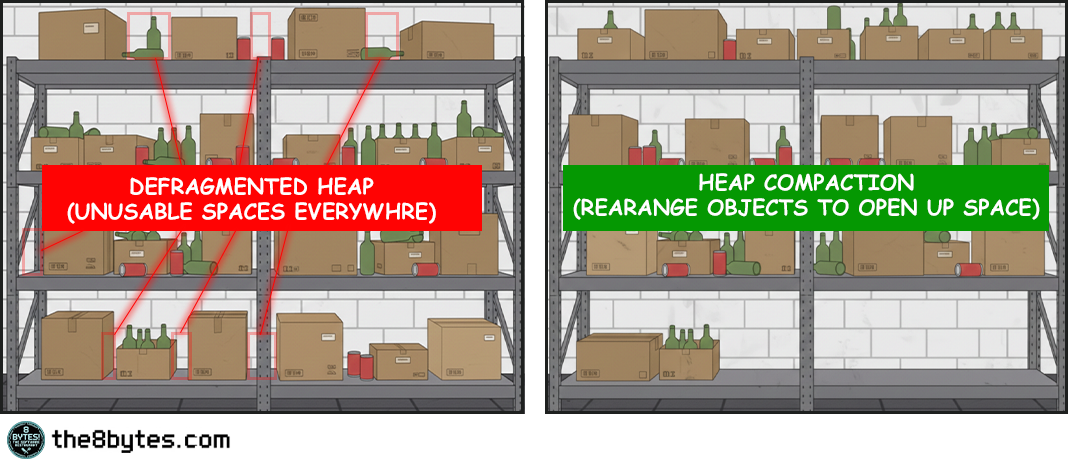
Compaction is what separates managed languages from manual memory management. In C or C++, when you free an object, you leave a gap in memory. Over time these gaps accumulate until you can’t allocate anything large even though plenty of total space remains. Managed languages solve this by moving objects around after freeing dead ones.
Compaction is like having Ollie and Oscar reorganize the warehouse after that chaotic morning. Boxes were scattered everywhere with gaps between them. Some gaps were small, some larger, but none big enough to be useful. Compaction pushes all the living boxes together to create one large continuous free space at the end. Now when the next delivery arrives, there’s room for it.
Here’s what happens during a compacting garbage collection. First, the collector traces through all object references starting from roots - stack variables, static fields, CPU registers. Any object it can reach is marked as alive. Everything else is garbage. So far this is the same as a non-compacting collector. But then comes the interesting part.
The collector copies all live objects to a new location in memory, packing them together tightly with no gaps. As it copies each object, it updates every reference that points to that object to point to the new location. Once everything is copied and all references are updated, the old memory is completely empty and can be reused. There’s no fragmentation because there are no gaps. All the live objects are packed together at the start of the region, and all the free space is one contiguous block at the end.
This is expensive. You’re copying potentially megabytes of data and updating thousands of references. But it completely eliminates external fragmentation, which means you never have the parking lot problem. As long as you have enough total free space, you can satisfy any allocation. The free space is always in one piece.
Personal Reflection
My kids' room basically “runs” GC compaction every Sunday.
Monday through Saturday, toys gradually scatter everywhere. LEGOs in one corner, dolls in another, books under the bed, cars near the door. By Saturday evening, the floor is like swiss cheese - you can walk, but you have to zigzag between toy islands. Total floor space is the same, but usable space is fragmented.
Sunday morning cleanup? Classic compaction algorithm. We push all the toys together into designated zones (toy box, bookshelf, LEGO bin). Suddenly, the entire center of the room is open again - one large contiguous play space instead of dozens of unusable gaps. The kids hate it because it takes time (pause time!). But without it? Eventually you can't walk to the bed even though "plenty of floor space exists."
Memory management. Parenting. Same problem.
How Different Platforms Handle Fragmentation
Both Java and .NET use generational collection, and they both learned it from watching restaurants. Young objects die fast, like fresh produce that spoils in hours. Old objects survive longer, like canned goods that last months. So Gen 0 gets collected frequently, Gen 2 rarely. This matches reality.
Java gives you choices. The Serial GC stops everything and compacts - simple but pauses your app. Parallel GC does the same with multiple threads - faster pauses, still noticeable. G1 GC changed the game by compacting incrementally with predictable pause times. The newest collectors - ZGC and Shenandoah - compact concurrently while your app runs, keeping pauses under 10 milliseconds even on multi-gigabyte heaps.
.NET gives you two modes. Workstation GC optimizes for low latency on desktops - collections happen on the thread that triggered them. Server GC optimizes for throughput on multi-core machines - dedicated GC threads, larger heaps, longer but less frequent pauses. Both compact all generations when they collect, but Server mode parallelizes the work.
The philosophy differs. Java says “here are six collectors with different trade-offs - pick the one that fits your needs.” .NET says “here are two modes for different scenarios - pick one and we’ll tune it for you.” Both approaches work. Java gives you fine-grained control if you want to become a GC expert. .NET gives you good defaults if you don’t.
But they solve the same fundamental problem. Without compaction, memory becomes swiss cheese over time. With compaction, free space stays contiguous and usable. The pineapple always fits when there’s no gaps.
Or is it?!
Enter the Large Object Heap
Remember when Big T arrived with that massive pineapple pallet? That moment captures perfectly what happens with large objects in managed memory. Compaction works great for small objects. Copying a 100-byte object is essentially free. Copying a 10KB object is still cheap. But copying a 10MB object? That's different.
A 10MB memcpy takes time. On modern hardware, maybe 3 milliseconds. That doesn't sound like much until you realize you're doing this during a garbage collection pause when your application is frozen.
App freeze?! Well, yeah! More about it - in our next episode “Stop the World”. So, don’t forget to subscribe! Now back to our story…
So, If you're compacting ten 10MB objects, that's 30 milliseconds right there, not counting the time to scan references and update pointers. For a desktop application, 30 milliseconds is perceptible latency. For a low-latency trading system, it's unacceptable.
So both Java and .NET make a pragmatic choice: large objects don't get compacted. They live in a separate region where they're allocated and freed without being moved.
.NET has an 85,000-byte threshold. Objects larger than this go to the Large Object Heap (LOH), which is collected as part of Generation 2 but isn't compacted by default. An array of 11,000 doubles? That's 88,000 bytes - straight to the LOH. A string with 43,000 characters? LOH territory. When you free a large object, it leaves a gap. Allocate and free enough large objects, and the LOH becomes fragmented.
Java's threshold is region-size dependent. In G1, objects larger than 50% of region size are "humongous objects." With 2MB regions (the default), anything over 1MB is humongous. These get allocated in contiguous sequences of regions and aren't compacted during normal young generation collections. Only full GCs or concurrent cycles reclaim them.
Both platforms make the same trade-off. Large objects are too expensive to move during collection pauses, so they don't get compacted, which means they can fragment the heap over time.
This is exactly what causes the pineapple problem. Allocate an 85kg pallet, use it, free it - you leave an 85kg gap. Do this repeatedly with varying sizes, and soon your warehouse is swiss cheese. Plenty of total space, but no single space big enough for the next delivery.
Solutions That Actually Work
First, know you have a problem. Monitor LOH size and fragmentation metrics in production. .NET exposes GC.GetGCMemoryInfo() with a FragmentedBytes field. Java has JMX counters for humongous allocations. If you’re seeing OutOfMemoryException with plenty of free memory showing in monitoring, you’ve got a pineapple problem - total space exists but isn’t contiguous.
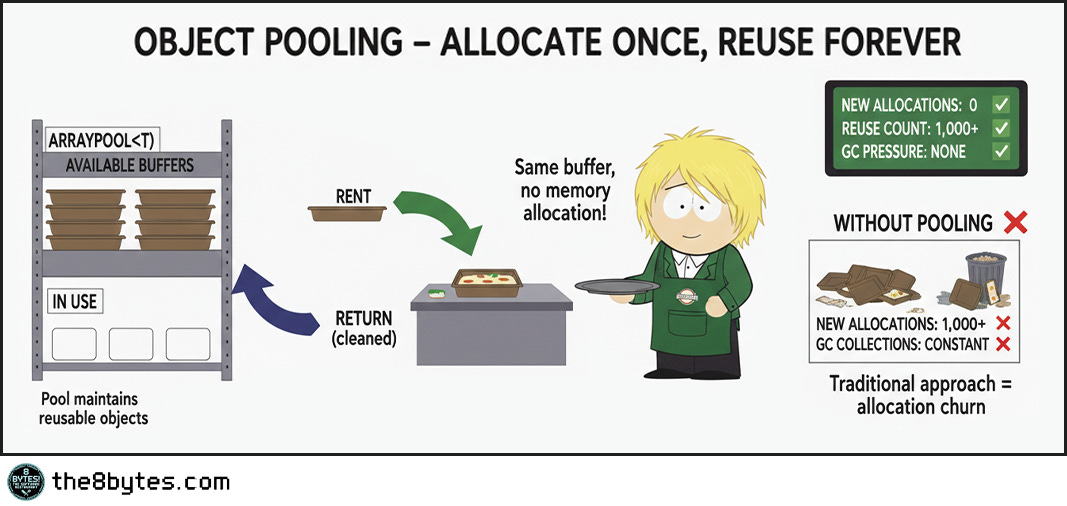
The first and best solution: Stop allocating large objects repeatedly. If you need a 1MB buffer for processing, allocate it once at startup and reuse it forever. This is object pooling, and it completely eliminates the problem.
Both platforms support this. In .NET, use ArrayPool<T> for array buffers. Rent an array when you need it, return it when you’re done. The pool maintains reusable arrays, so allocations after the first are essentially free - no GC pressure, no fragmentation, just fast reuse. In Java, use ByteBuffer.allocateDirect() for I/O buffers, which allocates outside the heap entirely.
If pooling won’t work, go native. For truly large objects that must be allocated repeatedly - images, video buffers, large caches - move them outside managed memory entirely. Use malloc in C, direct buffers in Java, Marshal.AllocHGlobal in .NET. Unity did this with textures after years of fragmentation crashes. High-performance database engines do this with buffer pools. You’re responsible for freeing memory manually, but you get precise control and zero fragmentation from large allocations.
Last resort: Force compaction explicitly. In .NET, set GCSettings.LargeObjectHeapCompactionMode before calling GC.Collect(). This compacts the LOH during the collection. It’s slow - you’re copying megabytes of data - so only do this during maintenance windows or when you know the application is idle. In Java, switching collectors might help. If you’re using older collectors and seeing fragmentation, try G1. If you need better latency with G1, try ZGC or Shenandoah. Each handles large objects differently.
The pattern is clear:
pool when possible
go native when necessary
force compaction as a last resort.
Don’t fight fragmentation - design around it!
Quick tips:
🔧 Production Pattern: Use ArrayPool in .NET or ByteBuffer.allocateDirect() in Java for any buffer >85KB that gets allocated repeatedly. Rent from pool, use, return. Zero LOH allocations = zero fragmentation. Also: monitor FragmentedBytes metric - alert at 30% of heap size.
💼 Business Decision Alert: LOH fragmentation is invisible until it crashes production. You can’t see it in standard memory graphs - the heap looks 40% free. Only shows as OutOfMemoryException under load. Ask: “Do we pool large objects or allocate them on demand?” Wrong answer = Unity’s 30-minute crash pattern.
Famous Failures - When Fragmentation Strikes
Microsoft Visual Studio 2012 (2012): The “Launch Day Crash”
Microsoft’s flagship IDE crashed when developers opened large solutions. OutOfMemoryException on machines with 8GB+ RAM. Users reported crashes after opening and closing several projects in succession.
The root cause was Roslyn, the new compiler infrastructure. Roslyn allocated large syntax trees for each source file (100-200KB each, right in the LOH range). Opening a project with 100 files meant 100 large allocations. Closing the project freed them, leaving gaps. After several open-close cycles, the LOH was so fragmented that new syntax tree allocations failed despite gigabytes of free memory.
Microsoft fixed it with object pooling for syntax trees. Instead of allocating new trees, Roslyn reuses them from a pool. No allocation cycles means no fragmentation.
Lesson learned: Even Microsoft’s own developers hit LOH fragmentation. Object pooling is non-negotiable for large, frequently-allocated objects.
Read more: Roslyn Performance Lessons
Unity Game Engine (2015-2018): The “Texture Memory Leak That Wasn’t”
Unity games crashed after 30-60 minutes of gameplay. Memory profilers showed plenty of free memory. No obvious leaks. Crashes seemed random and were difficult to reproduce in testing.
The culprit was texture loading. Unity loaded textures as managed byte arrays (2-10MB each). Each level load allocated dozens of textures. Each level unload freed them. Over an hour of gameplay with multiple level transitions, the heap fragmented severely. The textures were deallocated properly - no traditional leak. But each deallocated texture left a gap in the LOH. After enough level loads, no contiguous space remained even though 40% of the heap was free.
Unity fixed it by moving textures to native memory using CreateExternalTexture(). Native memory uses different allocation strategies that don’t fragment the same way.
Lesson learned: For truly large, frequently-replaced objects (images, videos, audio), consider unmanaged memory. The LOH isn’t designed for rapid churn.
Read more: Unity Memory Management
ASP.NET Core Kestrel (2016): The “HTTP/2 Memory Problem”
When ASP.NET Core added HTTP/2 support, Kestrel web server ran out of memory under high load despite memory not appearing “full” in monitoring.
The technical cause: HTTP/2 support used large buffers for connection state (120KB each, LOH territory). 1000 concurrent connections = 120MB in LOH. Connections opened and closed constantly. After hours of high traffic, the LOH fragmented until new 120KB allocations failed.
Microsoft implemented three fixes: (1) Buffer pooling using MemoryPool<byte>, (2) Reduced buffer sizes below 85KB when possible, (3) Slab allocator that pre-allocates large regions and sub-allocates from them.
Lesson learned: Web servers are particularly vulnerable - short-lived connections, large buffers, high volume. Perfect fragmentation storm. Only showed at production scale, not in testing.
Read more: Kestrel HTTP/2 Performance
Quick tips:
👨💼 For Your Next Board Meeting: “Visual Studio crashed on launch day. Unity games failed after 30 minutes. Kestrel web server ran out of memory under load. All three: LOH fragmentation. We need object pooling for all buffers >85KB and FragmentedBytes monitoring in production. Non-negotiable.”
👨🎓 Teaching Moment: Use the pineapple story. “Warehouse had 105kg free space scattered across zones. Pallet needed 85kg contiguous. Couldn’t fit. That’s fragmentation - total space exists but isn’t usable. Solution: pool the pallets (reuse large objects) or go native (unmanaged memory).”
Key Takeaways
The CEO-Digestible Recipe
When the CTO says “heap fragmentation despite available memory,” translate it like this:
♨ FRAGMENTATION - Memory gaps between boxes. Like parking spaces in 5 different lots - 100 total, but the bus can’t park.
♨ GENERATION 0, 1, 2 - Fresh produce (daily), refrigerated (weekly), frozen (monthly). Clean produce daily, freezer quarterly.
♨ COMPACTION - Push all boxes together, eliminate gaps. Free space becomes one contiguous block at the end.
♨ LARGE OBJECT HEAP (LOH) - Bus parking. Too expensive to move during cleanup, so gaps accumulate over time.
♨ 85KB THRESHOLD - Where objects become “large” in .NET. Above this, no automatic compaction.
♨ OBJECT POOLING - Reuse containers instead of ordering new ones. Like reusable bags vs disposable. No waste, no fragmentation.
♨ CONTIGUOUS SPACE - All in one piece. You can’t park a bus across three separate parking lots.
♨ HUMONGOUS OBJECTS - Java’s term for large objects (>50% of region size). Same problem, different name.
The Three Rules of LOH Management (Remember These)
1. If you’re allocating large objects repeatedly, you need pooling.
No pooling = Unity’s 30-minute crash pattern. ArrayPool exists for a reason.
2. Monitor fragmentation before OutOfMemoryException happens.
30% fragmented = warning. 40% = danger. 50% = gambling.
3. Total free memory is a lie when objects are large.
2GB free means nothing if you need 85KB contiguous. The pineapple needs one spot, not scattered pieces.
For Engineers: Fragmentation Detection Patterns
Watch for these patterns in production monitoring:
Pattern 1: The Invisible Crash
Symptom: OutOfMemoryException with 30-40% heap free in monitoring
Diagnosis: LOH fragmentation - total space exists but isn’t contiguous
Fix: Implement object pooling (ArrayPool, ByteBuffer.allocateDirect)
Pattern 2: The Slow Death
Symptom: Application runs fine for hours, then crashes under same load
Diagnosis: Cumulative fragmentation - gets worse over time (Unity’s 30-60 minute pattern)
Fix: Reduce large object churn through pooling or native memory
Pattern 3: The Load Amplifier
Symptom: Crashes only during traffic spikes, never steady load
Diagnosis: Burst allocations fragment faster than GC can compact (Kestrel’s HTTP/2 issue)
Fix: Pre-allocate buffer pools at startup, cap concurrent large allocations
Metrics to monitor:
LOH fragmentation percentage (alert at 30%, critical at 40%)
Large object allocation rate (>85KB allocations per minute)
Gen 2 collection frequency (increasing = fighting fragmentation)
Contiguous free space available (largest single block)
For Tech Leads: Design Review Questions
Before approving features that allocate large objects, require answers to:
1. What objects are >85KB in this design?
Be specific. “User data” isn’t enough. Need: “JPEG thumbnails averaging 150KB, allocated during upload processing.”
2. How frequently are these allocated?
Per-request (high risk), per-session (medium), or once at startup (low). Frequency determines risk.
3. What’s our pooling strategy?
“We’ll add it later” is not acceptable. Require: ArrayPool, ByteBuffer pools, or justification why not.
4. Can we use native memory instead?
For objects >1MB, consider Marshal.AllocHGlobal (.NET) or ByteBuffer.allocateDirect (Java). Manual management, zero fragmentation.
5. How do we test fragmentation behavior?
Require 4+ hour load tests with fragmentation monitoring. Unity pattern emerged at 30-60 minutes.
Team Practice: Quarterly “Memory Failure Drills”
Simulate:
Allocate large objects until 40% fragmented, attempt new allocation
Run 8 hours under load, measure fragmentation growth rate
10x traffic spike, measure fragmentation increase
Measure blast radius and recovery time. Use findings to tune pooling.
For Managers: Investment Priorities
What LOH fragmentation looks like in business terms:
Visual Studio 2012: Launch day crashes. Developers couldn’t open solutions. Emergency hotfix, support surge, reputation damage.
Unity Games: 30-60 minute crashes. “Game is broken” reviews. Patch delays, studio reputation at stake.
Kestrel Web Server: Memory exhaustion under HTTP/2 production load. Service degradation, lost requests, emergency scaling.
Common pattern: All preventable with object pooling and monitoring.
Questions to ask your CTO:
What services allocate objects >85KB in production?
Do we monitor LOH fragmentation or just total heap?
How long can we run before fragmentation becomes critical?
What’s our object pooling coverage for large allocations?
When did we last test fragmentation under sustained load (4+ hours)?
Budget Allocation:
Invest in prevention infrastructure:
Fragmentation monitoring - Can’t fix what you can’t see
Object pooling libraries - ArrayPool, ByteBuffer standards across services
Load testing capability - Multi-hour runs with real allocation patterns
Developer training - 2-day workshop on LOH management
The decision: Calculate hourly downtime cost. If one incident costs more than prevention investment, the math is simple.
Bonus content: download the episode comic:
Perfect for: Presentations, onboarding docs, tech talks
Using it? Reply and tell me!
Close Time
Cody, the bartender: “You know what’s funny about that pineapple delivery? We spent all afternoon organizing the warehouse perfectly. Generation 0 here, Generation 1 there, Generation 2 in the back. Everything compacted, no gaps, textbook memory management. And still the pineapples didn’t fit.
That’s the thing about large objects. They break the rules. Everything else gets moved around during garbage collection, pushed together, compacted. But not the big stuff. Too expensive to move. So it sits there, and when it eventually goes away, it leaves a hole.
I’ve been tending bar long enough to know that the same problems show up everywhere. It doesn’t matter if you’re running Java with G1 or .NET in server mode. Allocate and free large objects repeatedly, and eventually you’ll fragment your heap. The platforms handle it differently, sure. Java gives you ZGC and Shenandoah to compact concurrently. .NET lets you force LOH compaction if you’re desperate. But the fundamental problem is the same.
The smart architects don’t fight fragmentation. They design around it. Pool your buffers. Reuse large objects. Allocate the big stuff at startup and keep it around. Don’t churn through large allocations like you can with small ones. Because eventually, you’ll get a delivery that won’t fit, no matter how organized everything looks on paper.
To the pineapple problem. May your heaps stay compact and your large objects stay pooled.
Cheers. 🍹”
Episode 5 Drops in Two Weeks
In S01E05: “Stop the World” we will continue exploring the Garbage Collection secrets:
Cody: “Nina’s latest team-building idea: Taco Tuesday (using those leftover pineapples from the warehouse…) Julia reluctantly agrees... but adds a special ingredient. Ten minutes after lunch, Oscar and Ollie sprint for the bathrooms. Then Cody. Then Nina. Then everyone else. Every. Single. Bathroom. Occupied. Meanwhile, Jack Falcone sits in the dining room, waiting for service that isn’t coming. Twenty-five minutes pass. No staff. No food. No movement. The entire system has stopped.”
Coming: Stop-the-world GC pauses, why applications freeze during garbage collection, concurrent vs parallel strategies, and why a 50ms pause can cost millions in a trading system.
First time here? Start from the beginning:


Feedback?
Your Feedback Matters
This episode is unlocked for testing. I’m experimenting with:
Platform-agnostic explanations (Java + .NET)
Prose style with fewer bullets
Compaction deep dive
Large object handling comparison
What worked? What didn’t?
Hit reply and tell me:
Did the parking lot analogy click?
Was the Java vs .NET comparison useful?
Too much or too little on compaction?
Would you share this with your team?
Your feedback shapes future episodes. Comment below 👇
Know someone who’s hit OutOfMemoryException despite having free memory?Maybe they had a pineapple problem. Share this article!
Illustration credits: Comic scenes conceptualized by 8bytes! and rendered by Nano Banana.