


♨ Tacos de Venganza
Comic ‣ Deep-Dive ‣ Real Failures ‣ Takeaways ‣ Downloads
Cody, bartender at 8 bytes! The Software Restaurant: “I’ve seen stack overflows, starvation queues, stale data, and a warehouse full of pineapples that couldn’t fit anywhere. (You haven’t?! Check out our previous episodes!)
But what I can say is that I’d never seen Chef Julia weaponize her cooking.
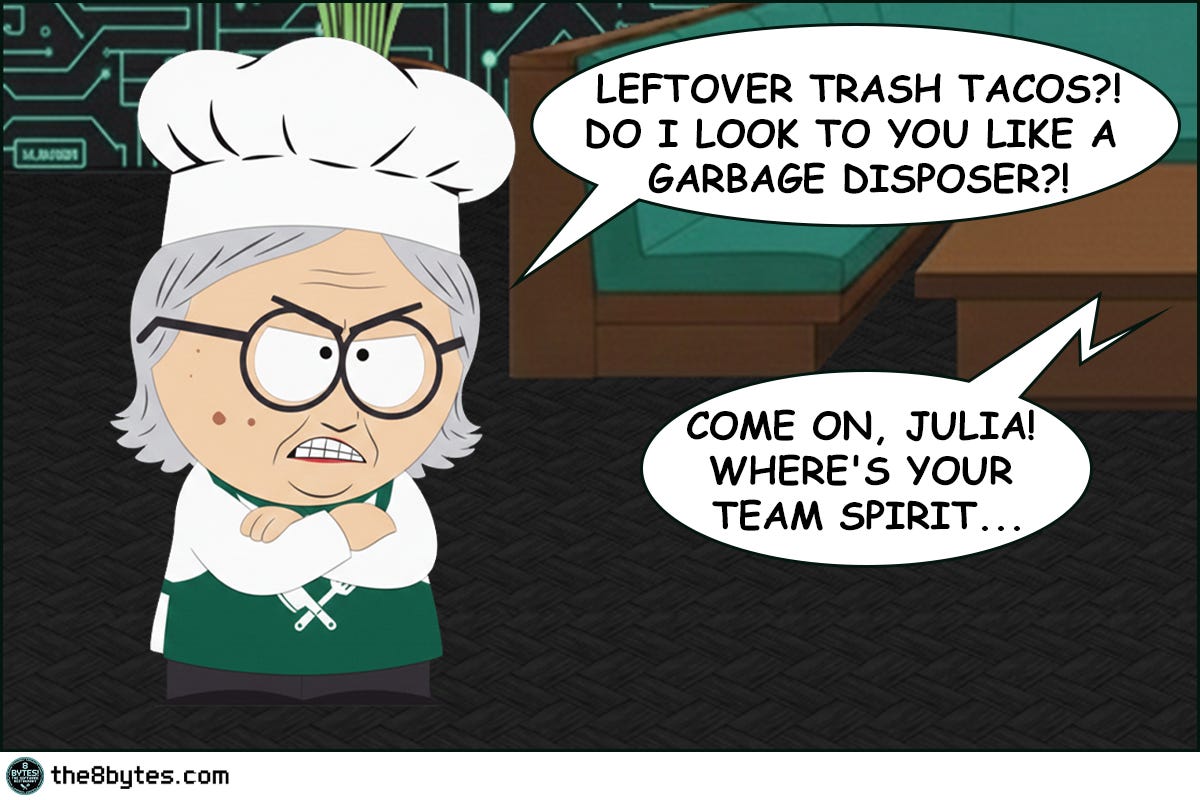
It started with Nina’s brilliant idea - Taco Tuesday. Team building, she called it. ‘Use up those leftover pineapples from the warehouse, boost morale, two birds - one stone.’ Julia didn’t argue much… That should have been the first warning.
But let’s start from the beginning...”


Steal These Now (Before Going Deep)
For Engineers: Before tuning GC flags, measure your actual pause times first. One GC.Collect() hidden in production code can freeze your entire service for seconds. Profile before you optimize.
➤ More for you? Deep Dive section awaits below.
For Tech Leads: Ask in every design review: “What’s our GC pause budget for this service?” If nobody has an answer, you don’t have a latency strategy - you have a prayer.
➤ More for you? Design Review Questions in the middle.
For Managers: A 200ms GC pause on a checkout page means lost transactions. Ask your CTO: “How long does our system freeze when memory cleanup runs, and what does that cost us per incident?”
➤ More for you? CEO Recipe near the end.
(Julia’s spicy tacos explain why these matter...)
What Just Happened in Julia’s Kitchen?
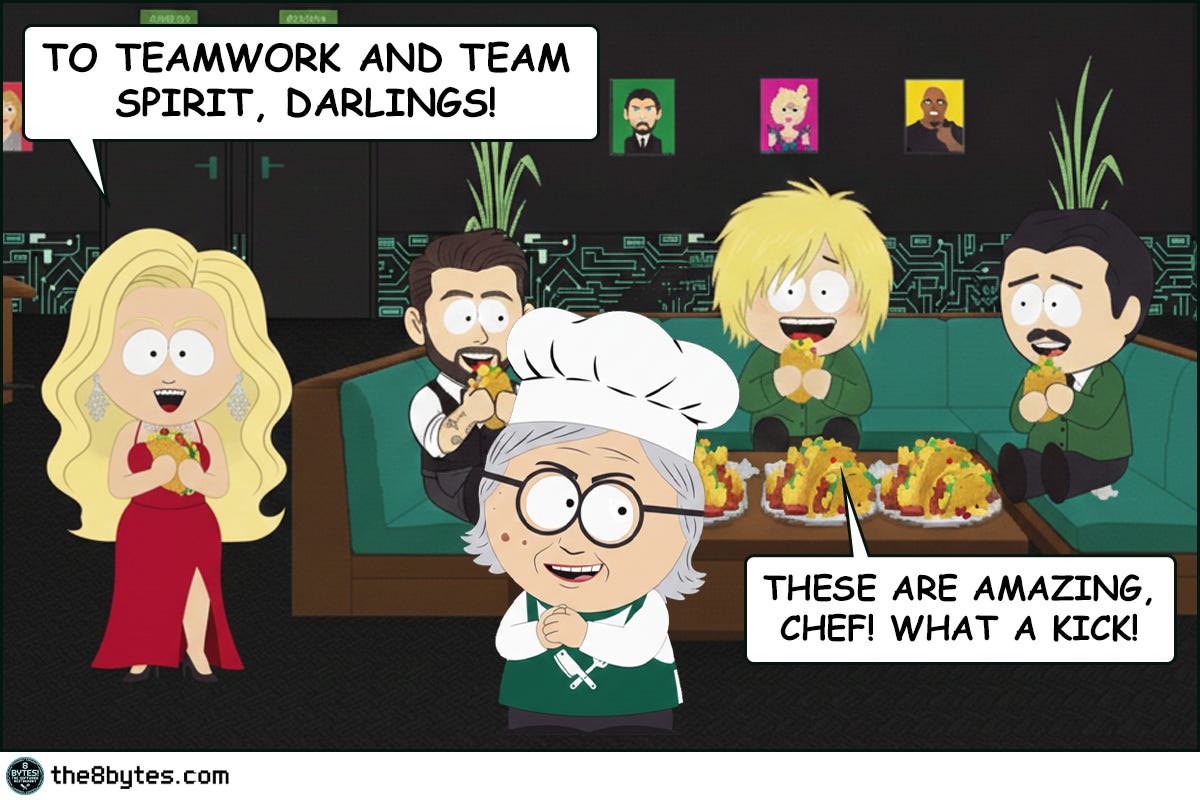
The warehouse was full of leftover pineapples. Nina’s brilliant solution: Taco Tuesday for team morale. Julia’s brilliant revenge: extra-hot peppers in every bite.
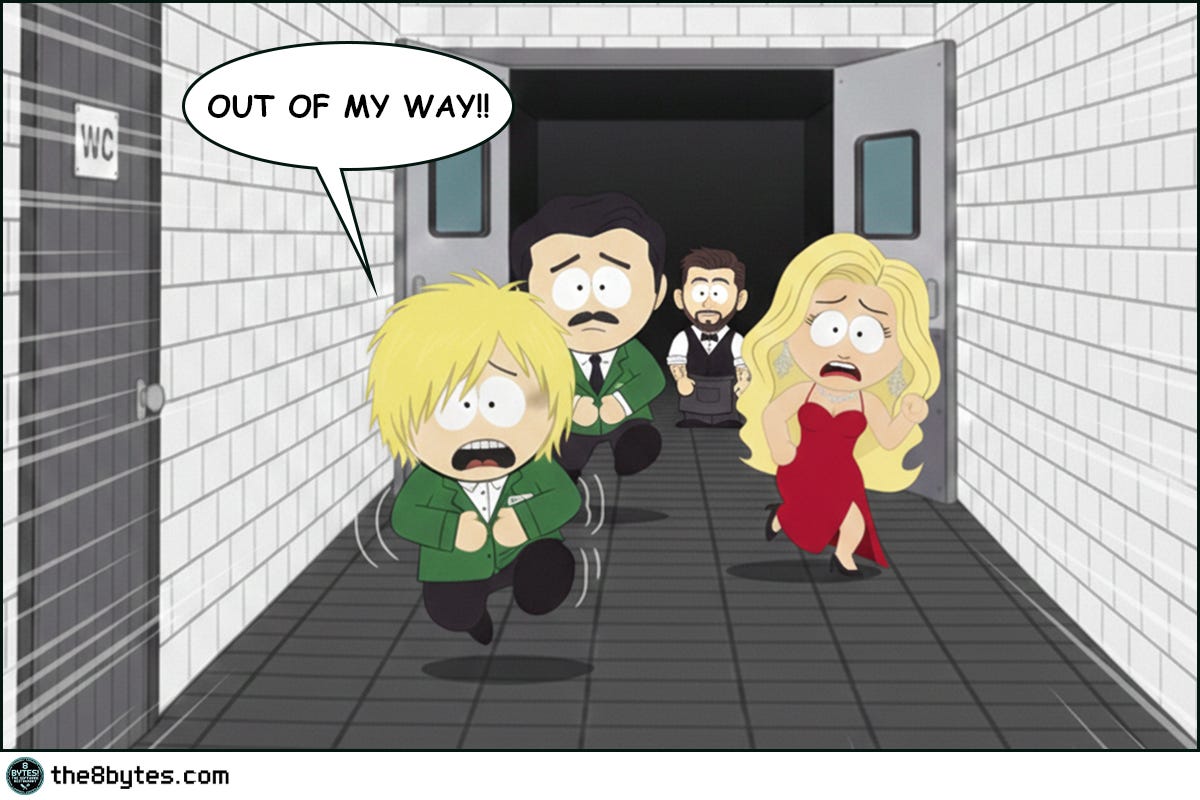
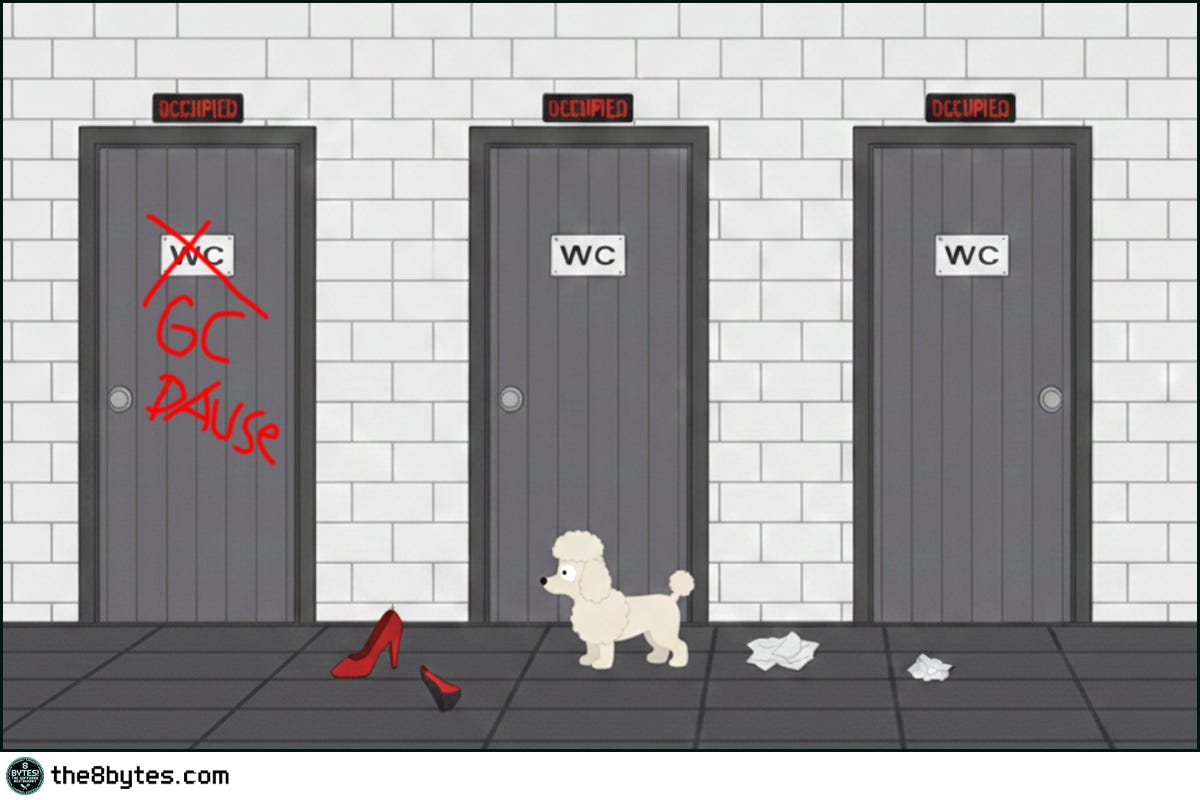
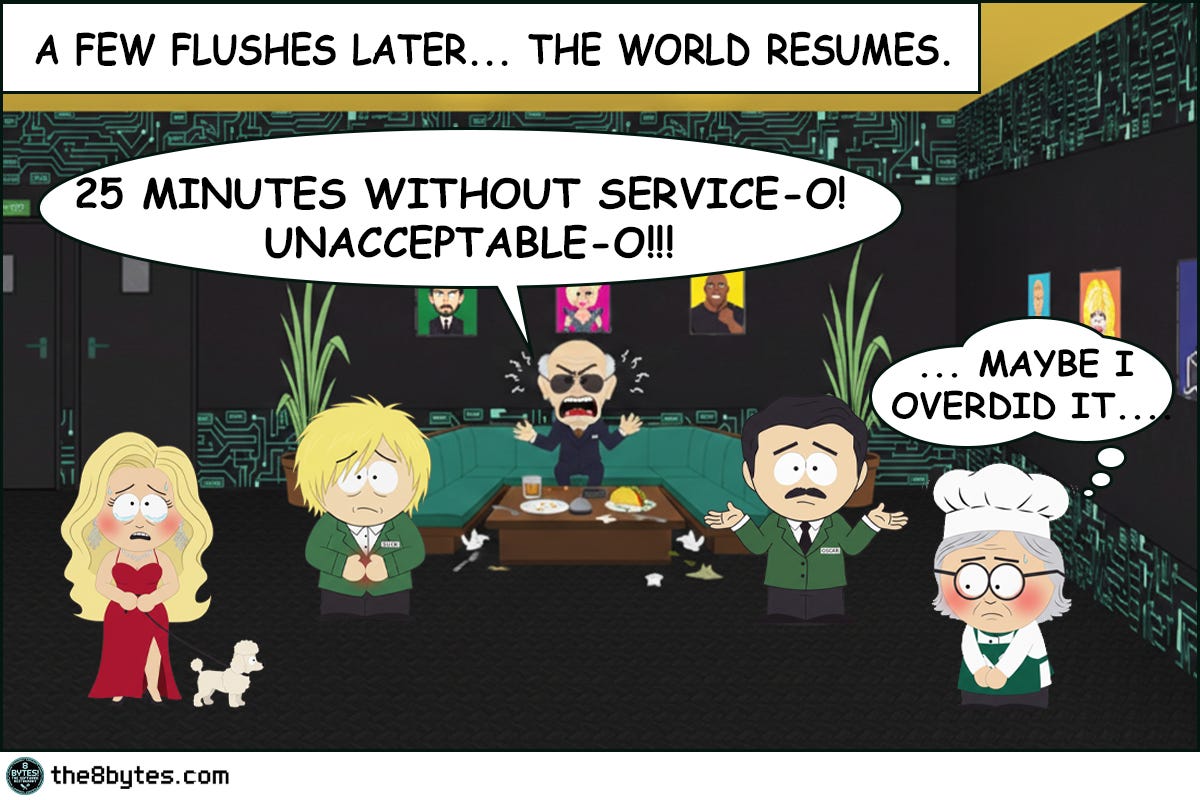
Ten minutes after lunch, the entire staff was locked in the restrooms. Oscar, Ollie, Cody, Nina - every single one. Meanwhile, Jack Falcone sat in the dining room, staring at an empty table. Twenty-five minutes. No service. No movement. No food.
Stop the World. When the garbage collector runs, everything freezes.
Welcome to Episode 5 of Season 1 “Memory Management”
8 episodes exploring Stack, Heap, Garbage Collection, Memory Leaks and other hilarious software disasters. New episodes drop bi-weekly:
✅ E01: Stack Overflow & Recursion → [Read now]
✅ E02: LIFO vs FIFO Starvation → [Read now]
✅ E03: Cache & Stale Data → [Read now]
✅ E04: Heap Fragmentation / GC / LOH → [Read now]
✅ E05: Garbage Collection - “Stop the World” → You are here
⏳ E06: Memory Leaks (drops Mar 05)
📅 E07: Race Conditions (drops Mar 19)
📅 E08: Deadlocks (drops Apr 02)
Deep Dive: Why Did the Entire Restaurant Freeze?
Picture Julia’s restaurant at peak dinner service. Orders flying in, Ollie running between tables, Oscar elegantly serving wine, Cody mixing cocktails. Every person is a thread doing useful work. The restaurant is humming.
Now picture every single staff member suddenly dropping what they’re doing and sprinting to the restroom. Plates left mid-air. Drinks half-poured. Customers mid-sentence with nobody listening. The restaurant doesn’t slow down - it stops. Completely. Nothing moves until every person finishes their restroom business and returns to their station.
This is a Stop-the-World pause, and it’s the most feared event in garbage-collected systems. When the garbage collector decides it needs to reclaim memory, it doesn’t politely ask your application threads to slow down. It pulls the emergency brake. Every thread must reach a safe stopping point - called a safepoint in Java or a safe point / suspension in .NET - and then freeze. No work happens. No requests get processed. No responses go out. The application is clinically dead until the GC finishes its job and releases the threads.

Why does it need to stop everything? Because the garbage collector is about to move objects around in memory. If your application threads are reading or writing those objects at the same time, you get corrupted data. It’s like trying to reorganize the warehouse shelves while Ollie is still pulling boxes off them - someone’s going to get the wrong box, or worse, grab empty air where a box used to be.
How Long Is “Too Long”?
Not all pauses are created equal. A 5-millisecond pause in a content management system? Nobody notices. A 50-millisecond pause in an online game? Players see a lag spike. A 200-millisecond pause in a trading system? You just lost money. Real money.
The tolerance depends entirely on what your application does. Here’s how to think about it. Interactive applications - games, trading platforms, video conferencing - need pause times under 10-16 milliseconds. That’s one frame in a 60fps game. Anything longer and users feel it. Web applications serving API requests can usually tolerate 50-200 milliseconds, but only if it happens rarely. If your p99 latency spikes to 500ms every time a Gen 2 collection runs, your SLA is in trouble. Batch processing systems and background workers? They can handle pauses of several seconds because nobody is sitting there waiting for a response.
The problem is that most teams don’t know their pause budget until they violate it. They build the application, deploy to production, and then discover at 3am that a full GC pause takes 1.2 seconds on a heap that grew to 8GB. By then, the incident has already started.
What Triggers a Stop-the-World Pause?
The garbage collector doesn’t run on a schedule like a cron job. It runs when it has to - typically when your application tries to allocate memory and there isn’t enough free space in the young generation.
Think of it like Julia’s kitchen. She doesn’t stop everything to clean unless she absolutely must. During normal service, she cleans as she goes - wiping counters between orders, tossing scraps in the bin. But when every surface is covered, every pan is dirty, and there’s literally no space to plate the next dish? Service stops. Everything stops. Clean first, cook later.
In technical terms, a young generation collection triggers when Eden space (Java) or Generation 0 (.NET) fills up. These collections are usually fast - a few milliseconds - because most young objects are already dead. The collector traces live objects, copies them to survivor space, and wipes Eden clean. Quick restroom break. Staff back in 30 seconds. Customers barely notice.
The expensive pauses come from full collections. When the old generation fills up, or when the young collection doesn’t free enough space, the collector has to scan the entire heap. Every object. Every reference. In a 4GB heap, that means walking millions of objects. This is the 25-minute restroom emergency from Julia’s kitchen - the kind where Jack Falcone starts checking his watch and guests walk out.
Quick tips:
🔧 Engineer tip: The single most common cause of unexpected long pauses? An explicit GC.Collect() or System.gc() hiding in production code. Search your codebase for it today. If someone put it there “just in case” - remove it. The runtime knows when to collect better than your code does.
💼 Manager tip: When your team says “the app froze for 2 seconds”, ask: “Was that a GC pause or something else?” If they can’t answer, you don’t have GC logging enabled. That’s like running a restaurant without security cameras - you only find out what happened after the damage is done.
The Safepoint Dance
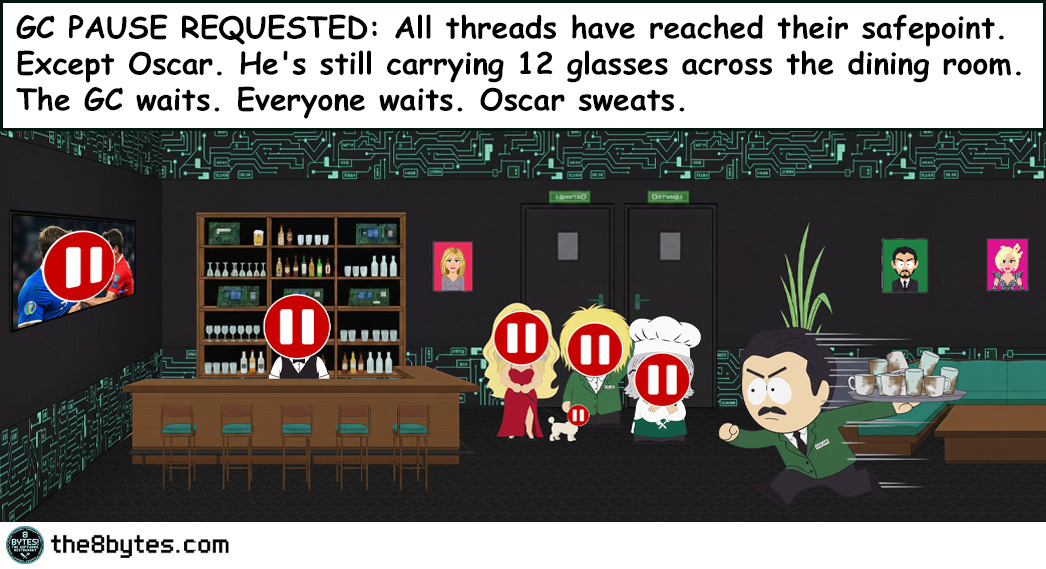
Before the GC can start working, every application thread must reach a safepoint. A safepoint is a point in your code where the runtime knows it’s safe to pause - all object references are in a consistent state, nothing is half-updated.
In Java, safepoints are inserted by the JIT compiler at method returns, loop backedges, and certain other locations. When the GC requests a pause, it sets a flag. Each thread checks this flag at the next safepoint and stops. The time between “GC wants to pause” and “all threads have actually stopped” is called time to safepoint, and it can be surprisingly long.
Here’s why. Imagine Oscar is in the middle of carrying a tray with 12 glasses across the restaurant. You can’t just freeze him mid-step - the glasses will crash. He needs to reach the table, set the tray down, and then he can stop. That’s a safepoint. But if Oscar is carrying the tray across a very long dining room, it takes time for him to reach the table. In code, this looks like a counted loop without a safepoint check - a tight loop that runs for thousands of iterations before hitting a safepoint. The GC is waiting, other threads have already stopped, and everyone is waiting for Oscar to finish his walk.
.NET handles this slightly differently with thread suspension, but the principle is the same. All managed threads must reach a point where they can be safely suspended before the GC begins work.
How it works in JAVA and .NET
Java’s Collector Strategies: From Full Stop to Almost-Never Stop
In Episode 4 we looked at how different collectors handle compaction. Now let’s look at how they handle pauses.
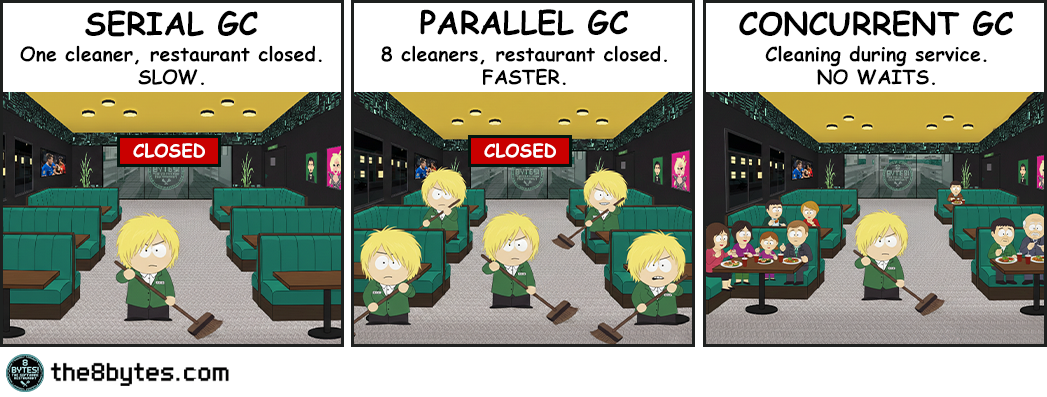
Serial GC is the simplest and the most brutal. One thread, full stop, scan everything, compact everything. On a 1GB heap, expect pauses of 500ms to several seconds. This is the entire restaurant closing for deep cleaning while customers wait outside. Fine for small batch applications. Catastrophic for anything user-facing.
Parallel GC uses multiple threads but still stops the world for the entire collection. Eight cores means eight threads scanning and compacting simultaneously. The pause is shorter - maybe 200ms instead of 800ms on the same heap - but it’s still a full stop. The restaurant closes, but eight cleaners work instead of one. Faster, but customers are still locked out.
G1 GC changed the game by introducing incremental collection. Instead of collecting the entire old generation at once, G1 divides the heap into regions and collects the most garbage-rich regions first. Young collections still stop the world, but they’re fast because they only touch young regions. Mixed collections (young + some old regions) are also stop-the-world, but G1 tries to keep them under a target pause time. You tell G1 “keep pauses under 200ms” with -XX:MaxGCPauseMillis=200 and it tries to collect only enough regions to stay within budget.
The keyword is “tries.” G1 can’t guarantee pause times. If fragmentation is bad or if humongous objects fill up regions, G1 might need a full collection - and that full collection is still stop-the-world, just like Serial or Parallel.
ZGC and Shenandoah are the breakthrough. They perform almost all GC work - marking, relocation, reference processing - concurrently while your application runs. Pause times stay under 10 milliseconds regardless of heap size. A 16GB heap? Sub-10ms pauses. A 128GB heap? Still sub-10ms.
How? By using techniques like colored pointers (ZGC) or forwarding pointers (Shenandoah) that allow the collector to move objects while application threads continue accessing them. It’s like having an invisible cleanup crew that reorganizes the restaurant while service continues. Waiters don’t even notice the tables being wiped down behind them. There’s overhead - read barriers and write barriers add a small cost to every object access - but for latency-sensitive applications, the trade-off is worth it.
.NET’s Approach: Background GC
.NET doesn’t give you a menu of collectors like Java. Instead, it has one collector with two modes and a critical feature called Background GC.
In the default configuration, Gen 0 and Gen 1 collections are always stop-the-world. But they’re fast - typically under 10 milliseconds - because these generations are small. The objects are young, most are dead, and the collector zips through them quickly.
Gen 2 is where things get expensive. A full Gen 2 collection on a large heap can pause for hundreds of milliseconds. This is where Background GC comes in. Instead of stopping the world for the entire Gen 2 collection, Background GC runs the marking phase concurrently on a dedicated thread. Your application continues running while the GC identifies which old objects are alive and which are garbage.
The application still pauses briefly - at the start and end of the background collection - but these pauses are short. The bulk of the work happens in the background. It’s like having a restaurant manager who walks around during service, quietly noting which tables need clearing, without actually stopping anyone. Then during a brief lull, the busboys swoop in and clear only what’s needed.
Server GC in .NET takes this further with dedicated GC threads per processor. Each processor gets its own managed heap and its own GC thread, allowing collections to happen in parallel. On a 16-core server, you get 16 heaps collected simultaneously. Young collections are fast. Background Gen 2 collections minimize pause impact.
But here’s the catch: even with Background GC, .NET can still trigger a blocking Gen 2 collection if memory pressure is severe. When the runtime determines that background collection isn’t freeing memory fast enough, it falls back to a full stop-the-world Gen 2 collection. This is the nuclear option - the moment when even the most optimized system freezes.
Beyond Java and .NET: How Other Languages Handle the Pause
Not every language has this problem - and not every language solves it the same way.
Go took a radical approach: keep GC pauses so short that nobody complains. Go’s garbage collector is fully concurrent with sub-millisecond pauses, but it trades throughput for latency. Go doesn’t compact memory at all - it uses a non-moving collector, which avoids the “stop everyone to rearrange furniture” problem entirely. The trade-off? More memory fragmentation over time, but for Go’s target workload of network services, it works beautifully.
Rust avoids the question entirely. No garbage collector. No pauses. Ever. Memory is managed at compile time through ownership and borrowing rules. When an object goes out of scope, it’s freed immediately. Zero runtime cost. The trade-off is complexity - Rust’s ownership model has a steep learning curve, and the compiler will fight you until you get it right. But for systems where any pause is unacceptable, Rust eliminates the problem at its root.
Python and Ruby use reference counting plus a backup tracing collector for circular references. The pauses are generally short, but neither language is designed for latency-sensitive workloads. If you’re hitting GC pauses in Python, the answer is usually “move the hot path to a different language.”
The pattern is universal: every managed language makes a trade-off between developer convenience and runtime pauses. Java and .NET give you the most control over that trade-off. Go optimizes for one specific answer. Rust says “no trade-off needed - but you’ll pay at compile time instead.”
Concurrent vs. Parallel - They’re Not the Same Thing
These two terms get confused constantly, even by experienced developers. Let’s clear it up with Julia’s kitchen.
Parallel collection means multiple GC threads work simultaneously, but the application is stopped. Picture the restaurant closing at midnight. Eight cleaners come in and clean the entire place in parallel - one does the kitchen, one does the bar, one does the dining room. Fast cleanup, but no customers served during that time. Multiple workers, zero application work.
Concurrent collection means the GC works at the same time as the application. Picture one cleaner working during service - quietly wiping tables after guests leave, sweeping under chairs, restocking napkins. Service never stops. The cleaning is slower because the cleaner has to work around active customers, but nobody waits.
Modern collectors combine both. ZGC uses concurrent marking and concurrent relocation (cleaning during service) but parallelizes those concurrent phases across multiple GC threads (multiple cleaners working during service). The application keeps running while multiple GC threads work simultaneously in the background.
The trade-off is throughput. Concurrent collectors use CPU cycles for GC work that could otherwise go to application work. If your server is already at 90% CPU serving requests, adding concurrent GC threads pushes it to 95%. The pauses are tiny, but overall throughput drops. Parallel stop-the-world collectors have the opposite trade-off: pauses are longer, but between pauses, 100% of CPU goes to your application.
Choose based on what matters more. Latency-sensitive? Go concurrent (ZGC, Shenandoah, .NET Background GC). Throughput-sensitive? Parallel might actually be better. Batch processing? Serial might even be fine.
My Personal Reflection on Concurrent Collection
I live this trade-off every weekend. My wife and I try to clean the apartment while the kids are home - concurrent mode. We vacuum around them, organize shelves while they pull toys off the next one, fold laundry while they unfold it for fun. We’re technically “cleaning” but the throughput is miserable. Two hours of work, 30% improvement at best.
Then summer vacation hits. The kids go to their grandparents for two weeks. Stop-the-world mode. The apartment is empty, no active threads running. We blitz through every room in one Saturday morning. Deep clean. Reorganize. Donate. Done. The “pause” is dramatic - no kids for two weeks - but the result is spotless.
Concurrent collection. Parenting. Same trade-off.
Measuring What Matters
You can’t optimize what you don’t measure. Here’s what to track.
In Java, enable GC logging with -Xlog:gc* (Java 11+) or -verbose:gc -XX:+PrintGCDetails (older versions). Look for pause times in the logs. The line you care about says “Pause Young” or “Pause Full” followed by a duration. Track the maximum, the average, and the 99th percentile. If your p99 pause is 500ms but your SLA requires 200ms response times, you have a math problem that no amount of application optimization will fix.
In .NET, use the GC.GetGCMemoryInfo() API to access pause times programmatically. The PauseTimePercentage field tells you what fraction of total time your application spent paused for GC. If this number is above 5%, you’re spending one out of every twenty seconds frozen. Performance counters like “% Time in GC” give you real-time visibility in production monitoring.
Both platforms support ETW traces (Windows) or perf events (Linux) for detailed GC analysis. Tools like GCViewer (Java) and PerfView (.NET) visualize collection patterns over time. Look for patterns: are pauses getting longer as the application runs? That might indicate a growing old generation or fragmentation. Are full GCs happening frequently? Your heap might be too small, or you might be promoting too many objects.
The most dangerous metric is the one you’re not tracking. Set up alerts for GC pause time percentile thresholds before you need them. When the 3am incident happens, you’ll want that data already flowing.
Quick tips:
👨💻 Engineers: Add -Xlog:gc* (Java) or track % Time in GC (.NET) to every service today. You can’t fix what you can’t see. If your p99 pause exceeds your SLA, no amount of code optimization saves you.
👔 Tech Leads: Define a GC pause budget per service tier. Latency-critical services get ZGC/Shenandoah or Background GC. Batch processors can tolerate Parallel GC. Document the decision. Review it quarterly.
💼 Managers: GC pauses are invisible until they cost money. Ask: “What’s our worst-case freeze time in production, and when was the last time someone checked?”
Real-World Use Cases: When Pauses Actually Matter
So, should you always chase the lowest possible pause time? Absolutely not!
A batch ETL pipeline that processes data overnight doesn’t care about 2-second GC pauses. Nobody is waiting. Throughput matters more - finish the job faster, not smoother. Using Parallel GC with a large heap might actually be the best choice here because 100% of CPU goes to your application between collections.
An API serving mobile clients has a different profile. Users expect responses under 300ms. A 500ms GC pause means a timeout, a retry, and double the load on your server. Background GC (.NET) or G1 with a reasonable pause target (Java) handles this well. You trade a small amount of throughput for predictable latency.
A real-time trading system operates in a different universe entirely. Every millisecond matters. A 10ms pause means missed market opportunities. These systems either use ZGC/Shenandoah with sub-10ms pauses, or they avoid GC entirely by pre-allocating objects and using object pools. Some trading firms run on C++ or Rust specifically to eliminate GC pauses altogether.
An online multiplayer game needs consistent 16ms frames (60fps). A single GC pause longer than 16ms causes a visible stutter. Game engines like Unity moved to incremental GC specifically for this reason - spreading collection work across multiple frames instead of doing it all at once.
The lesson is context. The same 50ms pause is invisible in a batch job, acceptable in a web API, and catastrophic in a trading system. Know your budget before you choose your collector.
Famous Failures - When the World Stopped
Azul Systems & Wall Street (2000s-2010s): The “Pauseless GC” Arms Race
High-frequency trading firms were losing real money to GC pauses. A Java application managing order flow would freeze for 200-500ms during full collections. In markets where prices change every microsecond, half a second might as well be an hour. Trades executed at stale prices. Orders missed entirely. Risk calculations running on outdated data.
The problem was so severe that Azul Systems built an entire business around solving it. Their Zing JVM introduced the C4 collector - Continuously Concurrent Compacting Collector - which promised pauseless garbage collection. Trading firms paid premium licensing fees specifically to eliminate GC pauses. The fact that an entire company could sustain itself on solving one garbage collection problem tells you how expensive those pauses were.
Lesson learned: When milliseconds equal millions, GC pause time isn’t a technical detail - it’s a business-critical metric. Know your pause budget before your P&L teaches it to you.
Read more: Azul C4 Garbage Collector
Minecraft (2010-2015): The “Lag Spike” Era
Every Minecraft player from the early days remembers the dreaded lag spike. You’re mining, building, exploring - and suddenly the game freezes for 1-3 seconds. Then it snaps back like nothing happened. This wasn’t network lag. It was garbage collection.
Minecraft runs on Java with a notoriously allocation-heavy engine. Every block update, every entity tick, every chunk load creates temporary objects. The young generation fills up constantly. Most of the time, young collections are fast enough that players don’t notice. But periodically, the old generation fills up and triggers a full GC. On a server with a 4-8GB heap managing dozens of players, that full collection could pause the game for seconds.
Mojang spent years optimizing. They reduced object allocation rates, tuned GC parameters, and eventually recommended G1 GC with specific pause time targets for server operators. The community developed its own GC tuning guides - entire wikis dedicated to JVM flags for Minecraft servers. A game about building blocks accidentally became the world’s largest GC tuning tutorial.
Lesson learned: High allocation rates plus large heaps equal painful pauses. Reduce allocations first, tune the collector second. Your users feel every full GC.
Read more: Minecraft JVM Optimization Guide
Twitter’s “Fail Whale” Era (2008-2012): The Ruby-to-JVM Migration
Twitter’s early infrastructure ran on Ruby on Rails. As the platform exploded in popularity, response times became unpredictable. The famous “Fail Whale” error page appeared whenever the system couldn’t keep up. Part of the solution was migrating critical services to the JVM - first to Scala, then to Java.
But the JVM brought its own problems. Twitter’s timeline service, handling millions of requests per second, suffered GC pauses that cascaded through the system. A 500ms pause on one server meant requests piled up. Load balancers routed those requests to other servers, which then hit their own GC pauses under the extra load. The cascade could take down an entire cluster.
Twitter’s engineering team became pioneers in GC tuning at scale. They contributed to the development of low-pause collectors, shared detailed GC analysis methodologies, and built internal tools for real-time GC monitoring across thousands of JVM instances. Their experience directly influenced the development of modern low-latency collectors.
Lesson learned: GC pauses don’t happen in isolation. In distributed systems, one server’s pause becomes every server’s problem. Monitor GC across the fleet, not just individual instances.
Read more: Twitter Engineering - Taming GC Pauses
Key Takeaways
The CEO-Digestible Recipe
When the CTO says "the application froze due to a GC pause", translate it like this:
♨ Stop-the-World Pause: The restaurant closes for deep cleaning. No customers served until cleaning is done. The shorter the closure, the less revenue lost.
♨ Safepoint: The moment a waiter sets down their tray before stopping. Everyone must reach a safe stopping point before the cleanup crew can start.
♨ Young Generation Collection: Quick wipe of the prep counter between orders. Takes seconds, barely noticed. Happens constantly.
♨ Full / Gen 2 Collection: Deep cleaning the entire restaurant including the warehouse. Takes much longer. Happens rarely, but hurts when it does.
♨ Concurrent GC: A cleaner working during service - wiping tables, sweeping floors while customers eat. Service never stops, but the cleaner competes for space.
♨ Parallel GC: Eight cleaners blitzing the restaurant after closing. Fast, but the doors are locked until they finish.
♨ GC Pause Budget: How long your restaurant can close before customers walk out. A fast-food joint tolerates 30 seconds. A Michelin-star restaurant can’t close for even 5.
♨ Time to Safepoint: How long it takes the last waiter to set down their tray. If Oscar is crossing the dining room with 12 glasses, everyone waits for him.
♨ Background GC (.NET): A manager who quietly scopes out what needs cleaning during service, then sends the crew in during a brief lull. Minimal disruption.
♨ GC Tuning: Choosing between a fast daily wipe-down or a thorough weekly deep clean. Both have trade-offs. Pick the one that matches your service style.
Three Rules of GC Pause Management
1. Measure before you tune. Enabling GC logging costs almost nothing. Flying blind costs incidents. Know your p99 pause time before choosing a collector or adjusting heap size.
2. Match the collector to the workload. There is no universally “best” GC. A trading system needs ZGC. A batch pipeline is fine with Parallel GC. A web API probably wants G1 or Background GC. Context is everything.
3. Reduce allocation pressure first. The fastest garbage collection is the one that never happens. Object pooling, stack allocation, and reducing temporary object creation do more for pause times than any JVM flag.
For Engineers: Three debug patterns when you suspect GC pauses:
Pattern 1: The Latency Spike Correlation - Check if latency spikes align with GC events. Enable GC logging, overlay pause timestamps on your latency graph. If every p99 spike matches a Full GC event, you found your problem.
Pattern 2: The Promotion Rate Check - If young collections are frequent and objects keep getting promoted to the old generation, your young generation is too small or your objects live just long enough to escape. Increase young gen size or investigate why objects survive collection.
Pattern 3: The Heap Right-Sizing - A heap that’s too small triggers frequent collections. A heap that’s too large makes each collection slower. Start at 2-4x your live data set size and adjust based on observed collection frequency and pause duration.
Key metrics to track:
GC pause time (p50, p95, p99)
Collection frequency by generation
Promotion rate (objects moving from young to old)
Time to safepoint
Heap occupancy after collection (if it’s high, you need more heap or you have a leak)
For Tech Leads: Design Review Questions
Five questions for every design review:
What’s the expected allocation rate for this service under peak load?
Which garbage collector are we using, and why that one specifically?
What’s our GC pause budget based on our latency SLA?
Have we identified any hot paths that create excessive temporary objects?
Do we have GC monitoring and alerting configured before launch?
Team practice: Run a GC analysis session quarterly. Pull GC logs from production, visualize pause distributions, identify trends. Make it routine, not reactive.
For Managers: Investment Priorities
Business impact translation:
A GC pause is downtime that doesn’t show up in your uptime dashboard. Your application is technically “running” - the process is alive, the health check might even pass - but it’s not serving requests. For the duration of the pause, every user experiences a frozen screen, a timeout, or a failed transaction.
Five questions to ask your CTO:
What’s our worst-case GC pause time in production right now?
How does that compare to our SLA commitments?
Are we monitoring GC pauses across all services or just some?
When was the last time we reviewed our garbage collector choice?
What would a 2-second pause during peak traffic cost us in lost transactions?
Budget allocation:
Invest in observability and GC tuning expertise, not just bigger servers. Throwing RAM at a GC problem often makes it worse - larger heaps mean longer full collection pauses.
Metrics worth funding:
GC pause time monitoring per service (what’s actually happening)
Allocation profiling tools (where’s the pressure coming from)
Load testing with GC analysis (catch it before production)
Team training on GC fundamentals (prevent repeat incidents)
ROI Example: Twitter’s GC-related cascading failures affected millions of users during peak events. Investing in GC monitoring, collector migration, and engineering expertise transformed their platform reliability. The cost of one major outage dwarfs the investment in proper GC management.
Don’t wait for your own Fail Whale moment. Budget for GC observability now.
Bonus content: download the episode comic:
Miro: Sorry, but these are still in the oven. (My GC have paused unexpectedly). You can expect them ready for download by Saturday!
Perfect for: Presentations, onboarding docs, tech talks
Using it? Reply and tell me!
Close Time
Cody, the bartender: “You know what Julia always says? ‘A real chef never stops the kitchen.’ Well, today she stopped the entire restaurant. Not with a bad recipe or a broken oven - with hot peppers and a grudge.
But here’s the thing I realized while I was... indisposed. The freeze wasn’t the real problem. Freezes happen. Young generation collections happen dozens of times per minute in every application you’ve ever used, and you never notice. It’s the long ones that kill you. The full collections. The ones where every thread stops and waits.
The smart systems don’t eliminate pauses - they manage them. ZGC keeps them under 10 milliseconds no matter how big the heap. G1 lets you set a budget. Background GC in .NET does the heavy lifting while your app keeps running. Different strategies, same goal: don’t let the cleanup shut down the business.
But if I’ve learned anything from tending this bar, it’s that prevention beats cure. Pool your objects. Reduce your allocations. Size your heap properly. The best garbage collection is the one that never has to run a full sweep.
And maybe… just maybe… don’t let an angry chef make your team lunch.
Cheers. 🍹”
Episode 6 Drops in Two Weeks
In S01E06: “The Ghost Tables” we will explore the silent danger of Memory Leaks:
Cody: “Nina just hired a new manager - Bill States. Big JIRA fan, former agile coach. He's replacing our ticket rail with some kind of status board. Tables tracked from AVAILABLE to SEATED to SERVED to CLEARED. Nina's calling it ‘operational excellence’. Sounds great on paper. But I've been tending this bar long enough to know - the fancier the system, the harder the crash…
See you next time!
Coming: Memory leaks, forgotten references, resource lifecycle, and why “the system says it’s full” is the most expensive lie in software.
Your Feedback Matters
This episode is unlocked for testing. I’m experimenting with:
Concurrent vs parallel GC deep comparison
Personal reflections mixed with technical depth
Multi-language GC overview (Go, Rust, Python)
Restroom metaphor for stop-the-world pauses
What worked? What didn’t? Hit reply and tell me:
Did the concurrent vs parallel distinction click?
Was the multi-language comparison useful?
Too much or too little on Java vs .NET specifics?
Would you share this with your team?
Your feedback shapes future episodes. Comment below 👇
Know someone whose production system freezes mysteriously every few hours? Maybe their GC needs a pause budget. Share this article!
Illustration credits: Comic scenes conceptualized by 8bytes! and rendered by Nano Banana.