


♨ Risotto de Phantomo
Comic ‣ Deep-Dive ‣ Real Failures ‣ Takeaways ‣ Downloads
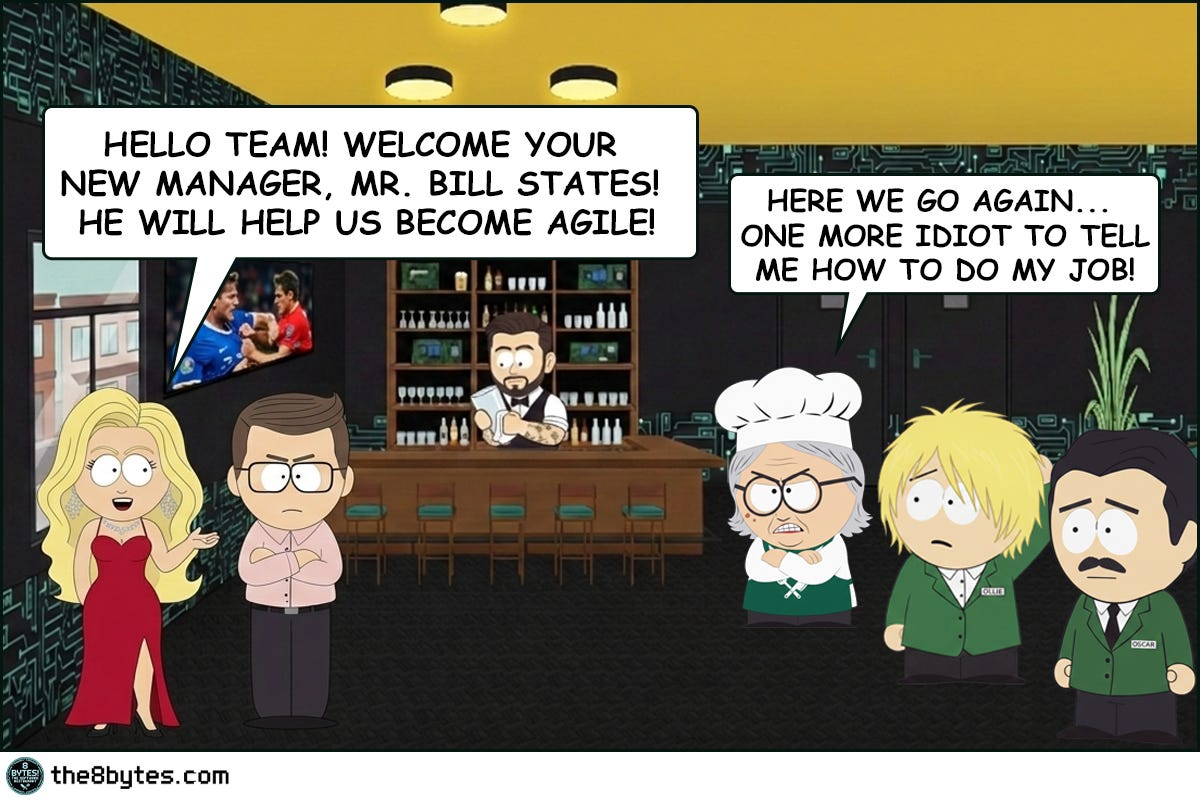
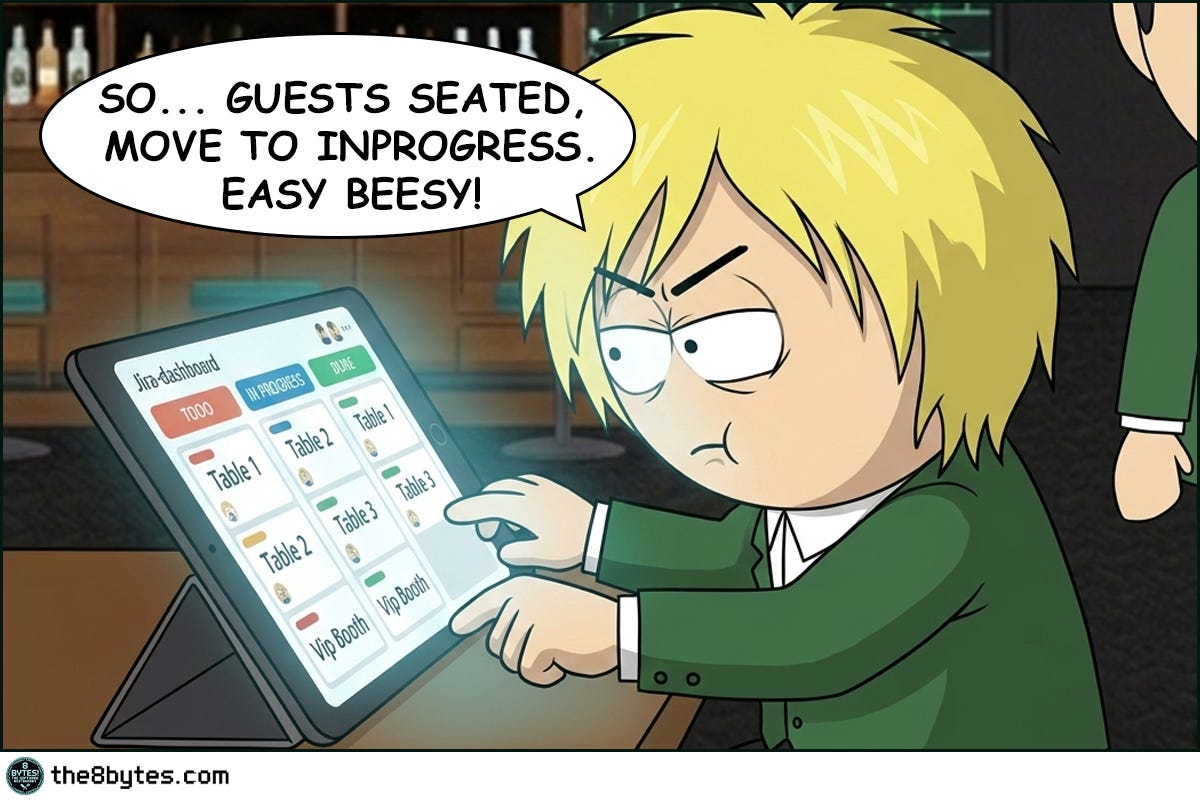
Cody, bartender at 8 bytes! The Software Restaurant: “Bill States, the new restaurant manager arrived with a tablet, a smile, and the unshakeable confidence of a man who had never witnessed what happens when humans meet systems at 11:30 PM after a double shift.
His system was elegant. Green for available. Red for occupied. One tap and the table was free. But as always in our restaurant, theory clashes with reality.
But back to the morning. I was wiping glasses, while…”


Steal These Now (Before Going Deep)
For Engineers: The next time your service slows down over 24-48 hours and only a restart fixes it - you’re looking at a memory leak. Start with heap dumps and object count trends, not CPU metrics.
➤ More for you? Deep Dive section awaits below.
For Tech Leads: Ask in your next design review: “Who owns the cleanup of this resource? Is it explicit or assumed?” Assumed cleanup is a future incident.
➤ More for you? Design Review Questions in the middle.
For Managers: Memory leaks are the restaurant equivalent of paying rent on tables that are permanently reserved but never used. Your capacity shrinks invisibly. The bill doesn’t.
➤ More for you? CEO Recipe near the end.
What Just Happened at Bill’s Restaurant?
The evening service ran perfectly. Tables turned, food went out, guests were happy. Ollie managed the system competently for hours.
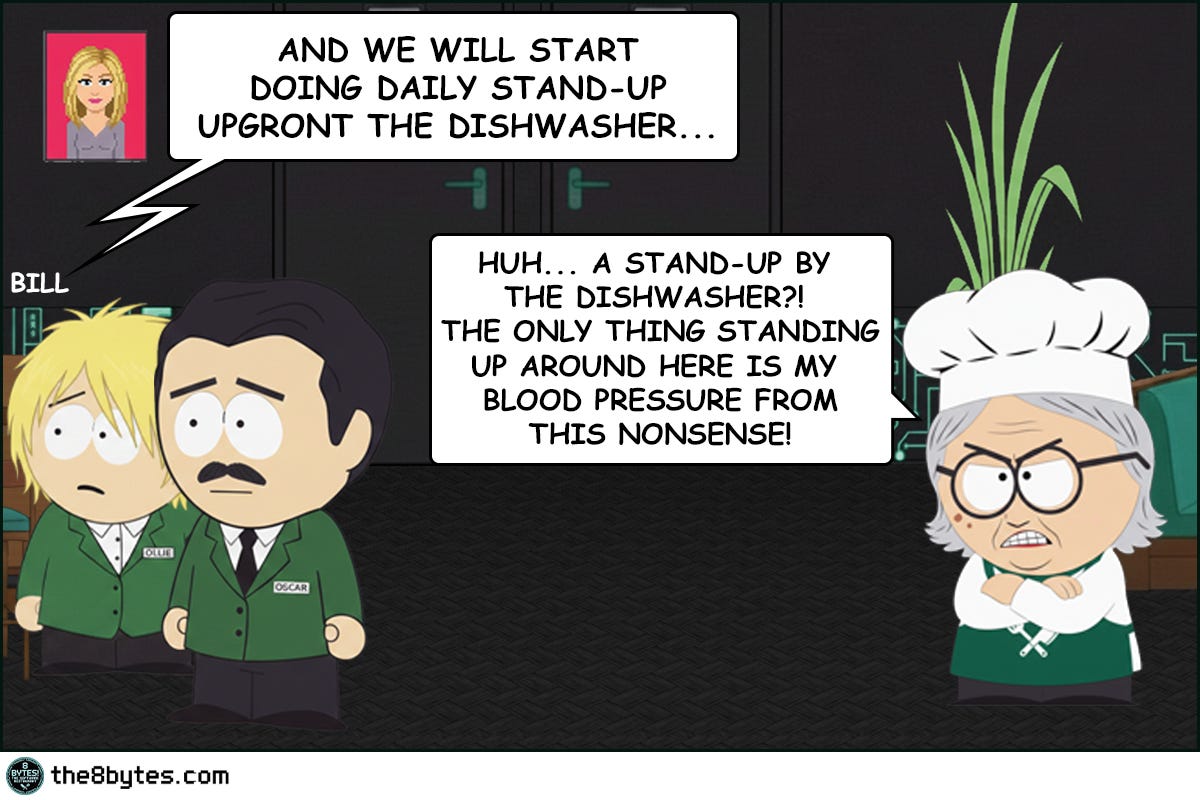
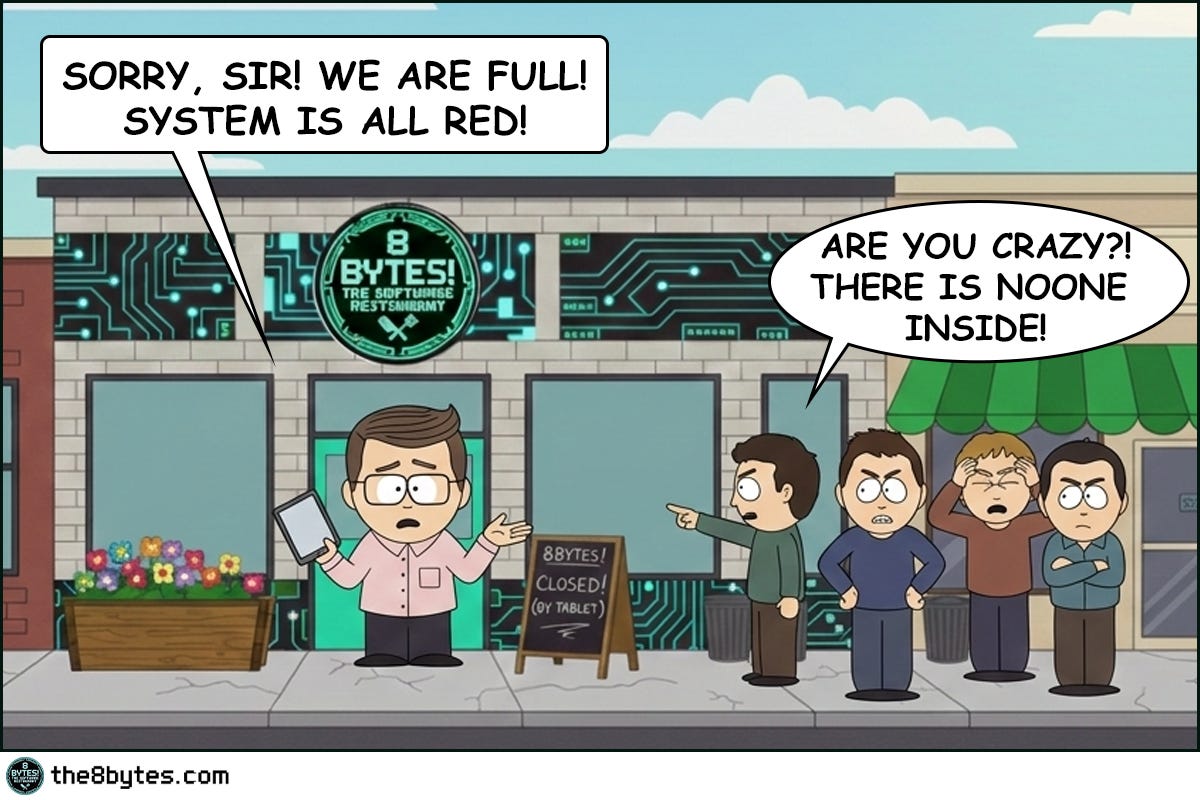
Then he got tired. One missed tap. Thirty-two tables stayed red in a system that had no idea the guests had left.
Memory Leak. The digital equivalent of a restaurant that’s fully booked on paper and completely empty in reality.
Welcome to Episode 6 of Season 1 “Memory Management”
8 episodes exploring Stack, Heap, Garbage Collection, Memory Leaks and other hilarious software disasters. New episodes drop bi-weekly:
✅ E01: Stack Overflow & Recursion → [Read now]
✅ E02: LIFO vs FIFO Starvation → [Read now]
✅ E03: Cache & Stale Data → [Read now]
✅ E04: Heap Fragmentation / GC / LOH → [Read now]
✅ E05: Garbage Collection - “Stop the World” → [Read now]
✅ E06: Memory Leaks (drops Mar 05) → You are here
⏳ E07: Race Conditions (drops Mar 19)
📅 E08: Deadlocks (drops Apr 02)
Deep Dive: Why Did the System Think It Was Full?
Memory Leaks - What Are They, Really?
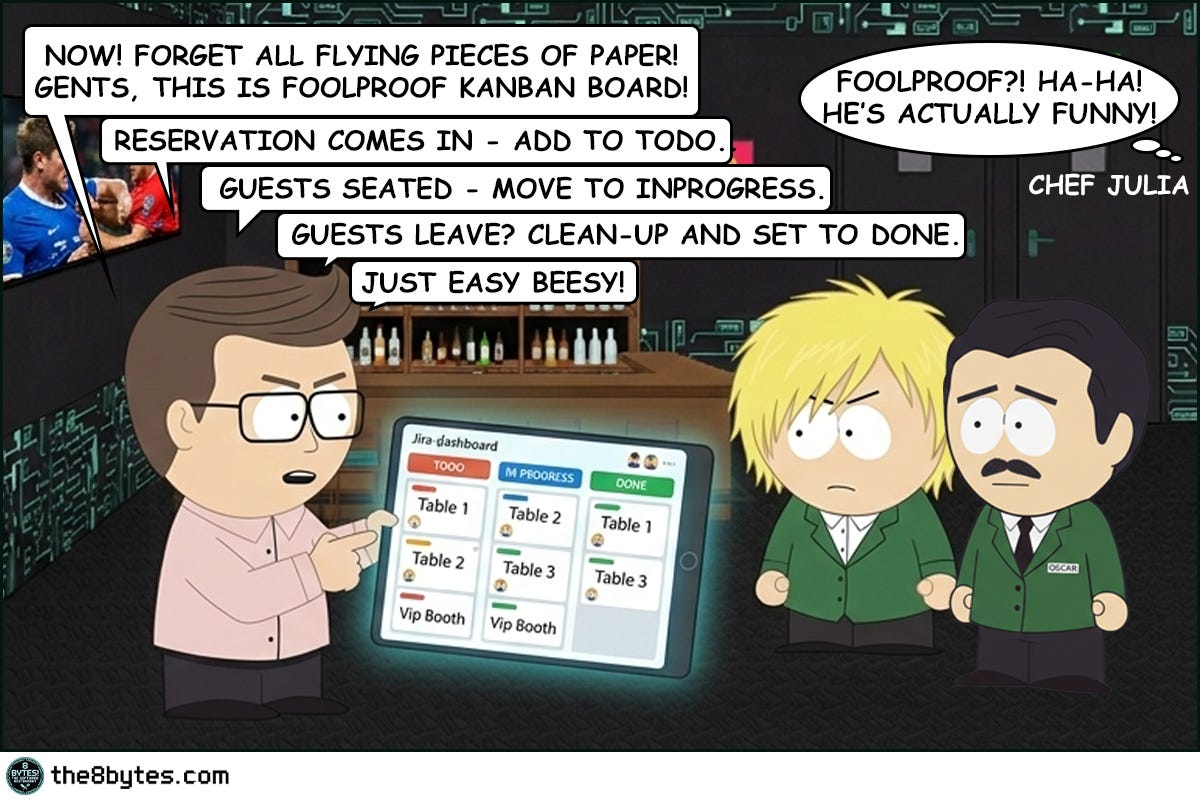
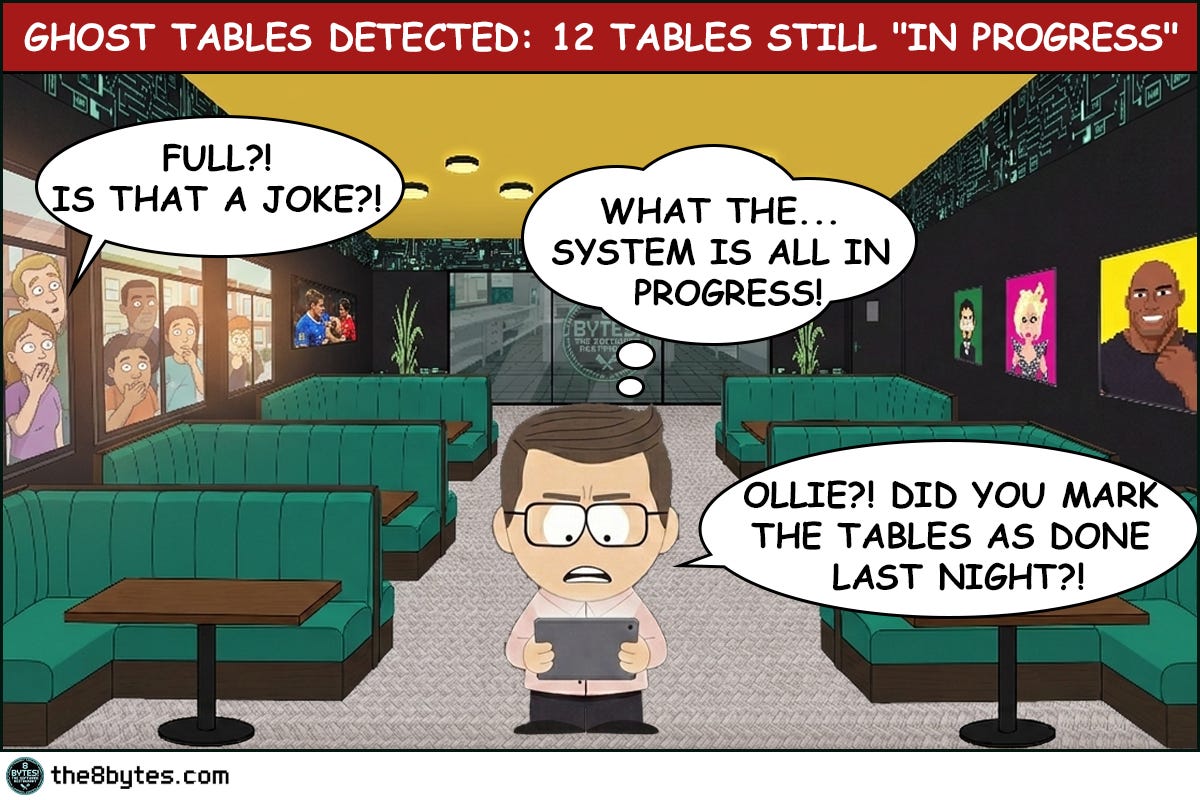
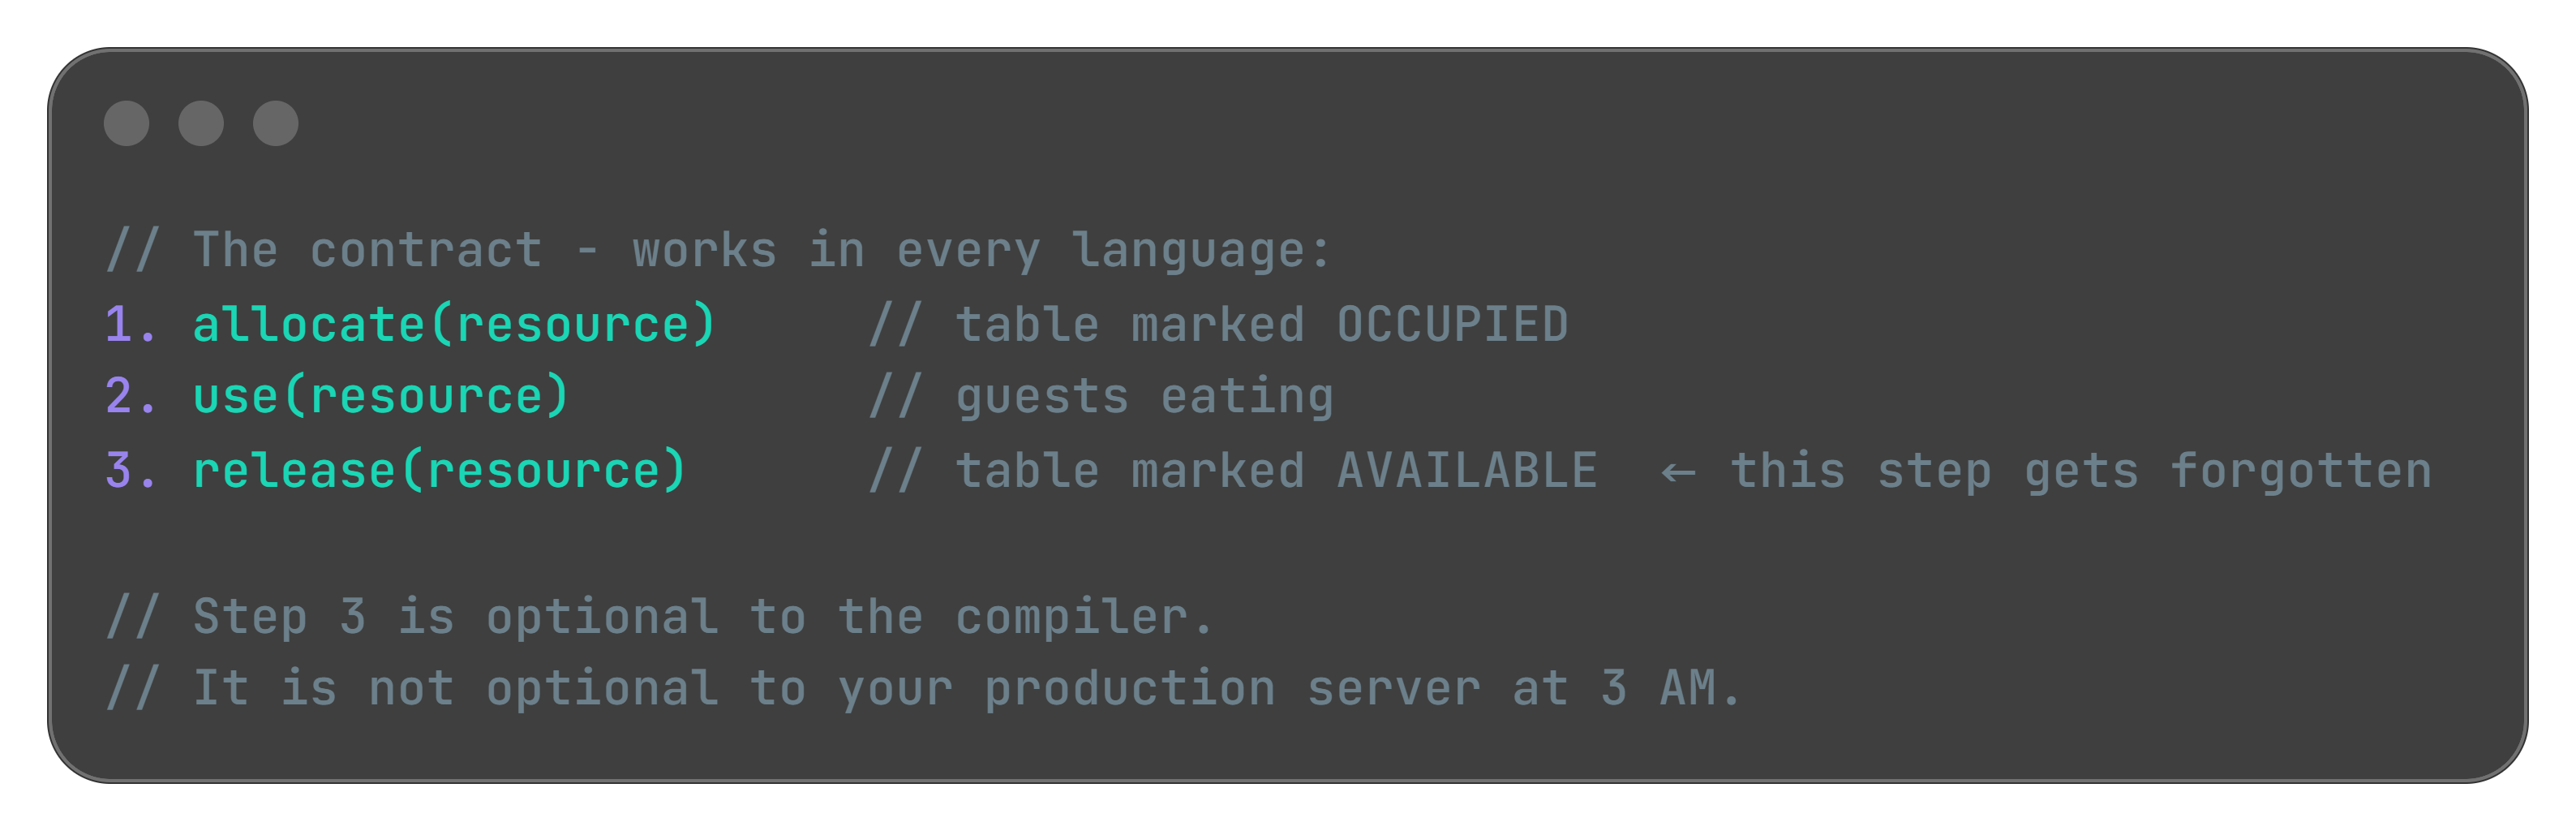
Bill’s reservation system had a simple contract: mark a table occupied when guests arrive, mark it available when they leave. The first half worked perfectly. The second half depended on Ollie remembering to tap a button at the end of a ten-hour shift. When he didn’t, the reference to that table stayed alive in the system - occupied, reserved, blocking new bookings - even though the physical reality had changed hours ago.
In software, a memory leak is exactly this: your program allocates memory to store something, uses it, but never releases it when it’s done. The object is gone from the world - the guest has left, the request is complete, the connection is closed - but the system still holds a reference to it. That memory is now a ghost. It contributes nothing, serves no purpose, but it counts against your total capacity. And unlike a restaurant where you can see the empty tables with your own eyes, in software you often can’t see this happening until the system starts struggling.
The insidious part is the timeline. Memory leaks rarely kill a system immediately. They grow slowly, quietly, imperceptibly. Your service starts consuming 200MB. Then 250. Then 400. Three days later it’s at 2GB and response times have doubled. You restart it, everything goes back to normal, and you tell yourself it was a one-off. Two weeks later, same thing. This pattern - the gradual degradation that magically heals on restart - is the classic memory leak signature.
The Anatomy of a Leak
To understand where leaks come from, think about how memory is supposed to work. When your code needs to store something - an object, a list, a connection, a cached value - it requests memory from the heap. The heap allocates a block, hands back a reference, and marks that block as in use. When your code is done with the object, it should release the reference, signaling to the memory manager that the block is available again.
The leak happens in the gap between “done using” and “releasing the reference.”
Think of it like this:
That gap is almost always caused by one of three things.
The first is forgotten references in long-lived collections. You add objects to a list, map, or cache that lives for the entire lifetime of your application. You add things in, but you never remove them. The collection grows forever. This is Ollie’s mistake in digital form - the tablet’s list of occupied tables grew one entry per evening, and nothing ever removed entries from it.
The second is event listeners and callbacks that outlive their owners. You subscribe to an event, or register a callback, but when the object that registered it is destroyed, the subscription stays active. The callback holds a reference to your dead object. Your dead object can’t be garbage collected. This pattern appears in every language and every framework - JavaScript’s .addEventListener() without .removeEventListener(), C#’s event subscriptions without unsubscribe, Java’s observer pattern without cleanup, Python’s signal handlers left dangling.
The third is resource handles that are never closed. Database connections, file handles, network sockets, HTTP clients - these are objects backed by external system resources. If you open them and don’t close them, you hold both the memory for the object AND the external resource it wraps. You can run out of either. And when you do, the error message rarely says “you forgot to close something.” It says “connection pool exhausted” or “too many open files” - and you spend three hours looking in the wrong place.
Why Garbage Collection Doesn’t Save You
“But we use a managed language. The GC handles memory automatically.”
Yes. And no.
Garbage collectors are brilliant at one thing: finding objects that have no references pointing to them and reclaiming that memory. The key phrase is no references. If your code still holds a reference to an object even accidentally, even uselessly, the GC will not touch it. It has no way to know that your reference is stale. It sees a live pointer and moves on.
This is true in Java. It’s true in .NET. It’s true in Python, JavaScript, Go, and Ruby. Every managed runtime has this same blind spot. The GC is not a substitute for thinking about object lifecycle. It never was.
Going back to Bill’s restaurant - the GC is the overnight cleaning crew. Efficient, reliable, thorough. But they only clear tables that have been marked available. If the tablet still shows a table as occupied - they walk right past it. They follow the manifest. They trust the data.
The manifest is your code. The data is your references. And if your code never releases the reference, the cleaning crew will never touch that table.
That’s your ghost table. That’s your memory leak.
Quick tips:
🔧 Production Pattern: Run your service for 48 hours under normal load, then check heap object counts - not just heap size. If HashMap$Entry, ArrayList, or any domain object (Order, Session, Connection) keeps climbing without plateauing, you have a leak. The GC isn’t broken. It’s doing exactly what you told it to do.
💼 Business Decision Alert: “We use Java/C#/.NET, so memory is managed automatically” is one of the most expensive misconceptions in enterprise software. Managed memory means the GC handles unreferenced objects. Leaked objects are still referenced. They are invisible to the GC and invisible to your team until the service starts struggling.
Technical Strategies: Finding and Fixing the Leak
Strategy 1: Identify the Pattern First
Before you open a profiler, look at your metrics. A memory leak has a distinctive shape in time-series graphs: a sawtooth pattern. Memory climbs steadily, hits a peak, drops when GC runs or the service restarts, then climbs again. Each cycle, the floor gets a little higher.
This is different from a memory spike (sudden jump, quick return to baseline) or healthy behavior (relatively flat line with minor fluctuations).
If your heap usage graph looks like ascending stairs over 24-48 hours, you have a leak. The pattern is the same whether you’re running Java, .NET, Node.js, or Python. Start with the graph, not the code.
Strategy 2: Count Objects, Not Bytes
Most developers look at memory usage in megabytes. That’s the wrong metric for leak detection.
The right metric is object count over time.
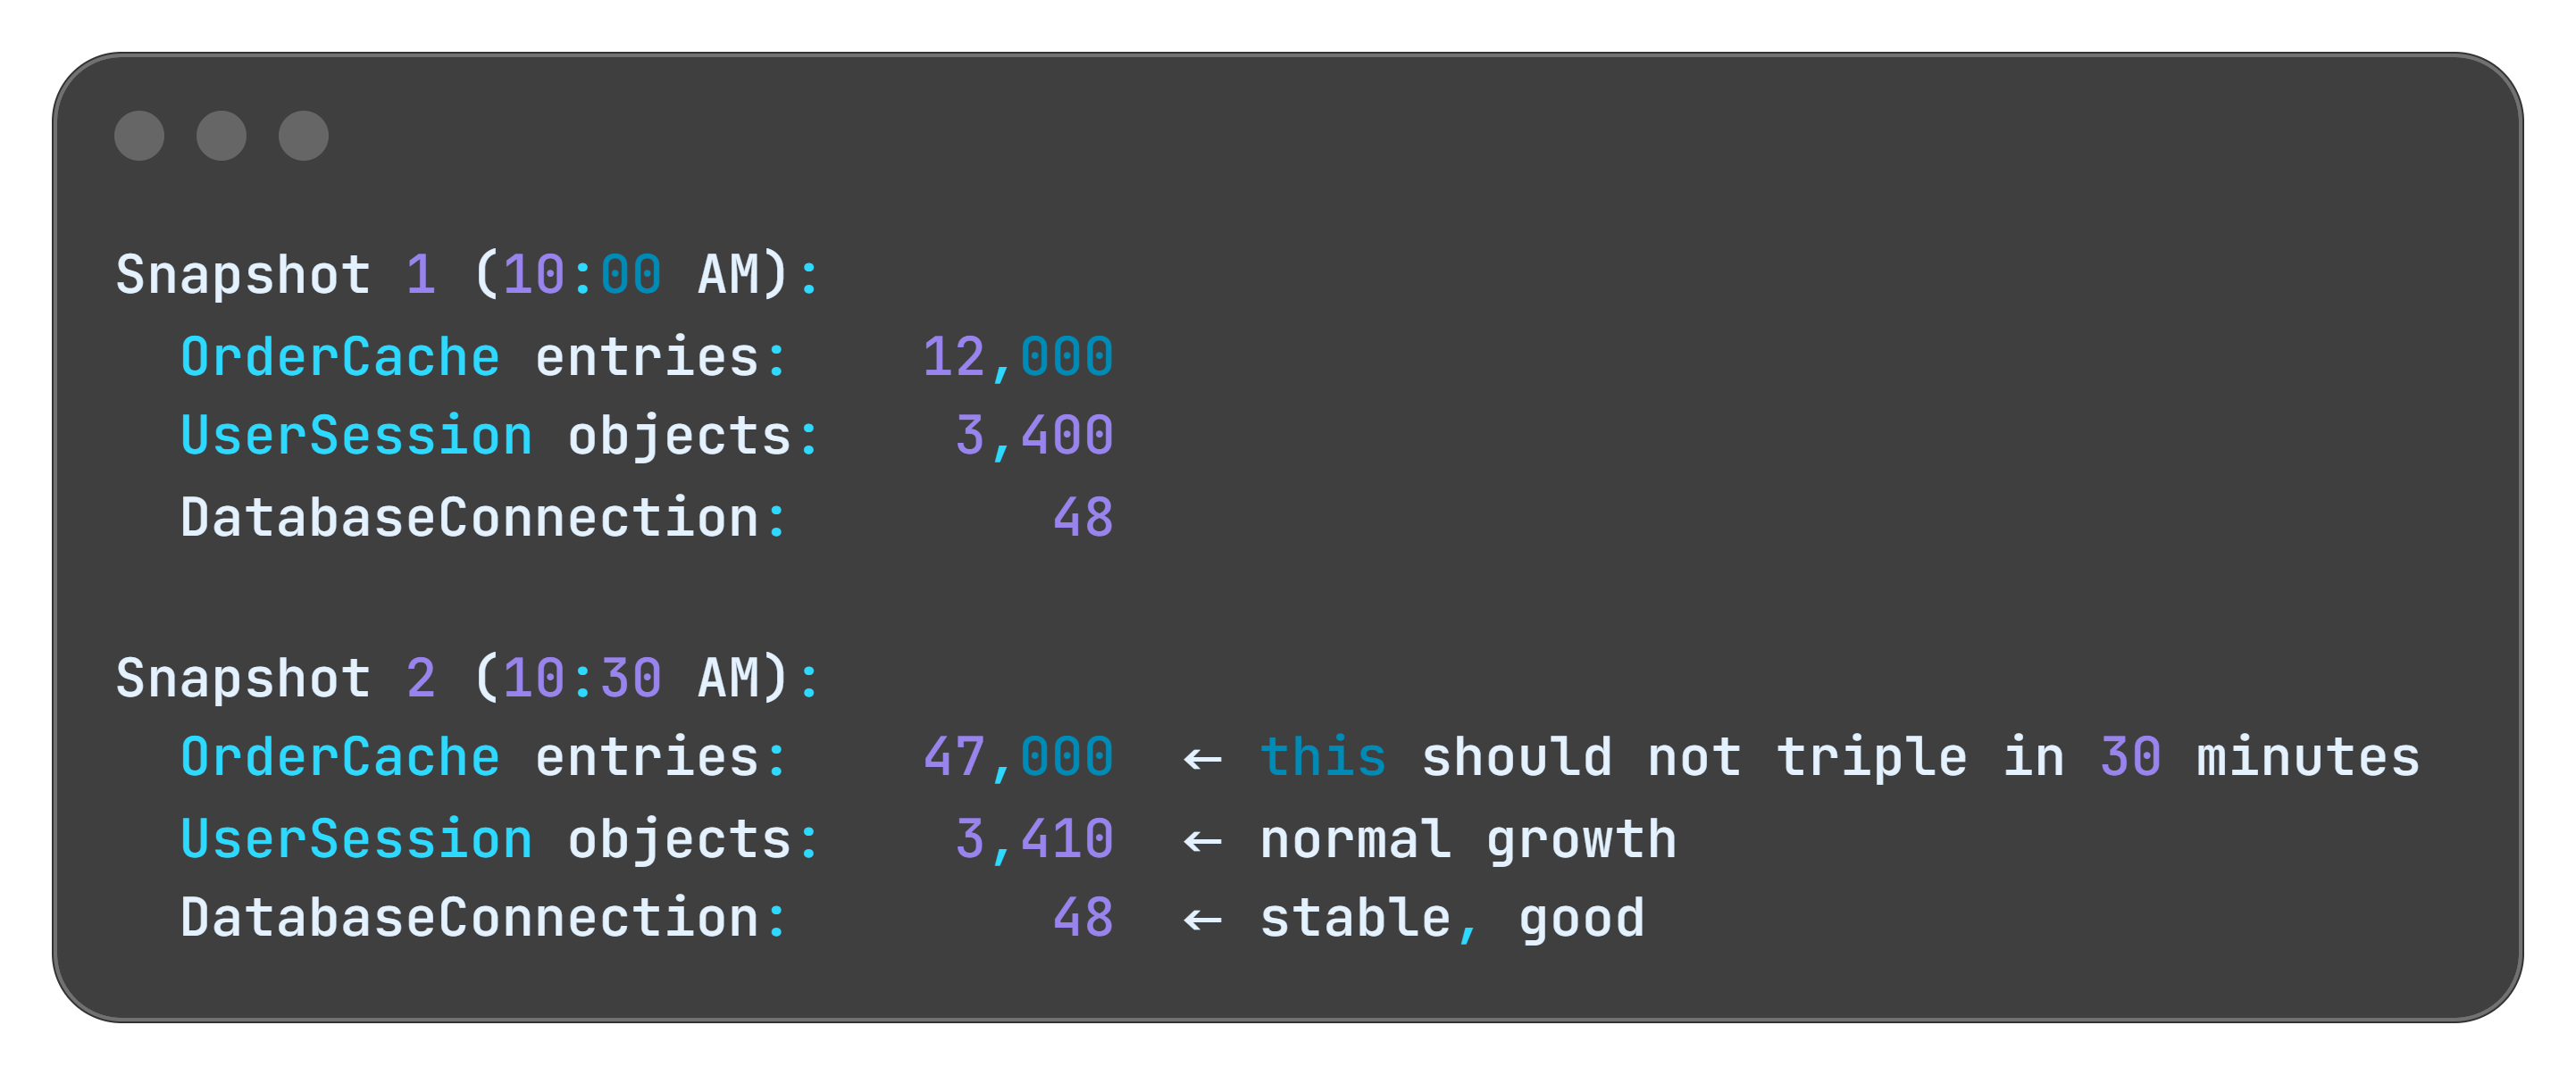
Take a snapshot of what’s in your heap right now. Wait 30 minutes under normal load. Take another snapshot. Compare the two - not the total size, but which object types keep growing. If your OrderCache entries went from 12,000 to 47,000 in 30 minutes with no corresponding increase in active users, you’ve found your ghost tables.
Every major runtime has tools for this. Java has VisualVM and Eclipse MAT. .NET has dotMemory and the built-in diagnostics tools. Python has tracemalloc. Node.js has the V8 heap snapshot in Chrome DevTools. The tool names differ. The technique is identical.
Strategy 3: Make Cleanup Explicit
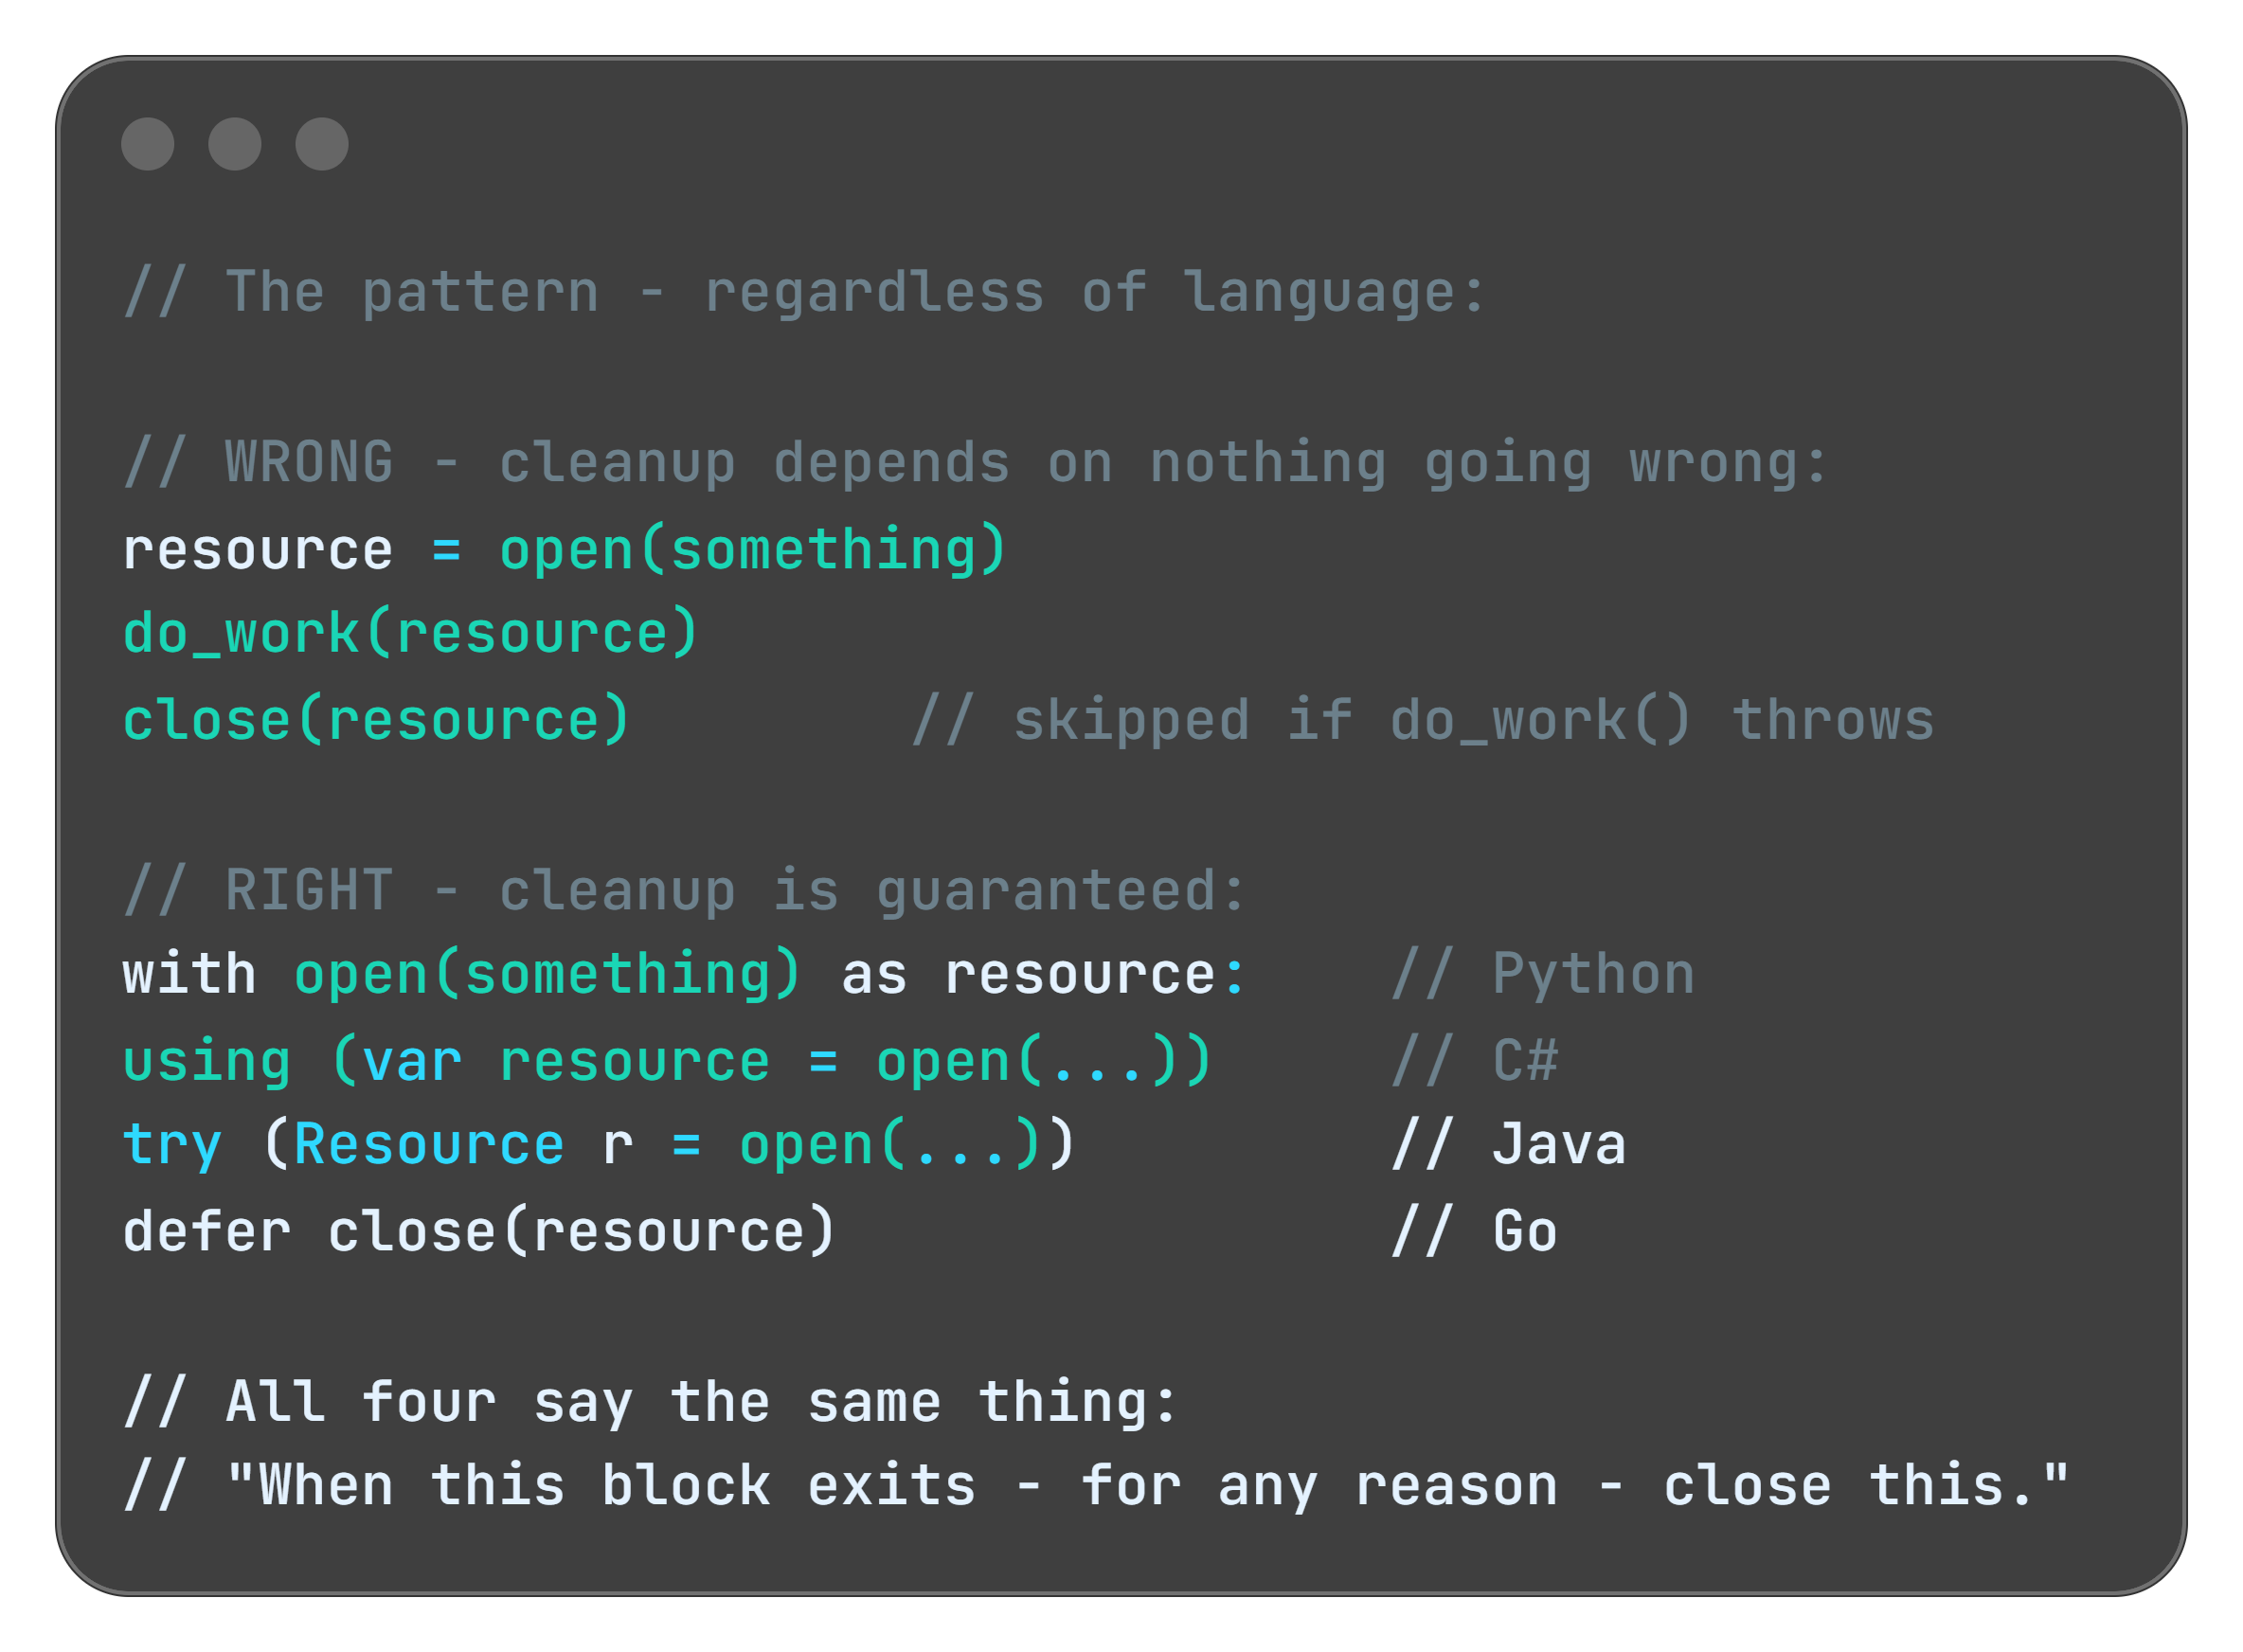
The solution to most memory leaks is making cleanup a first-class concern of your design, not an afterthought. For every “open” there should be a corresponding “close.” For every “add” a corresponding “remove.” For every “subscribe” a corresponding “unsubscribe.”
Most modern languages give you a construct that guarantees cleanup even when exceptions occur:
Java:
try-with-resources.NET/C#:
usingstatementPython:
withstatementGo:
defer
They all solve the same problem: you forgot to write the cleanup code, or the cleanup code was there but an exception skipped it. These constructs make cleanup automatic and unconditional.
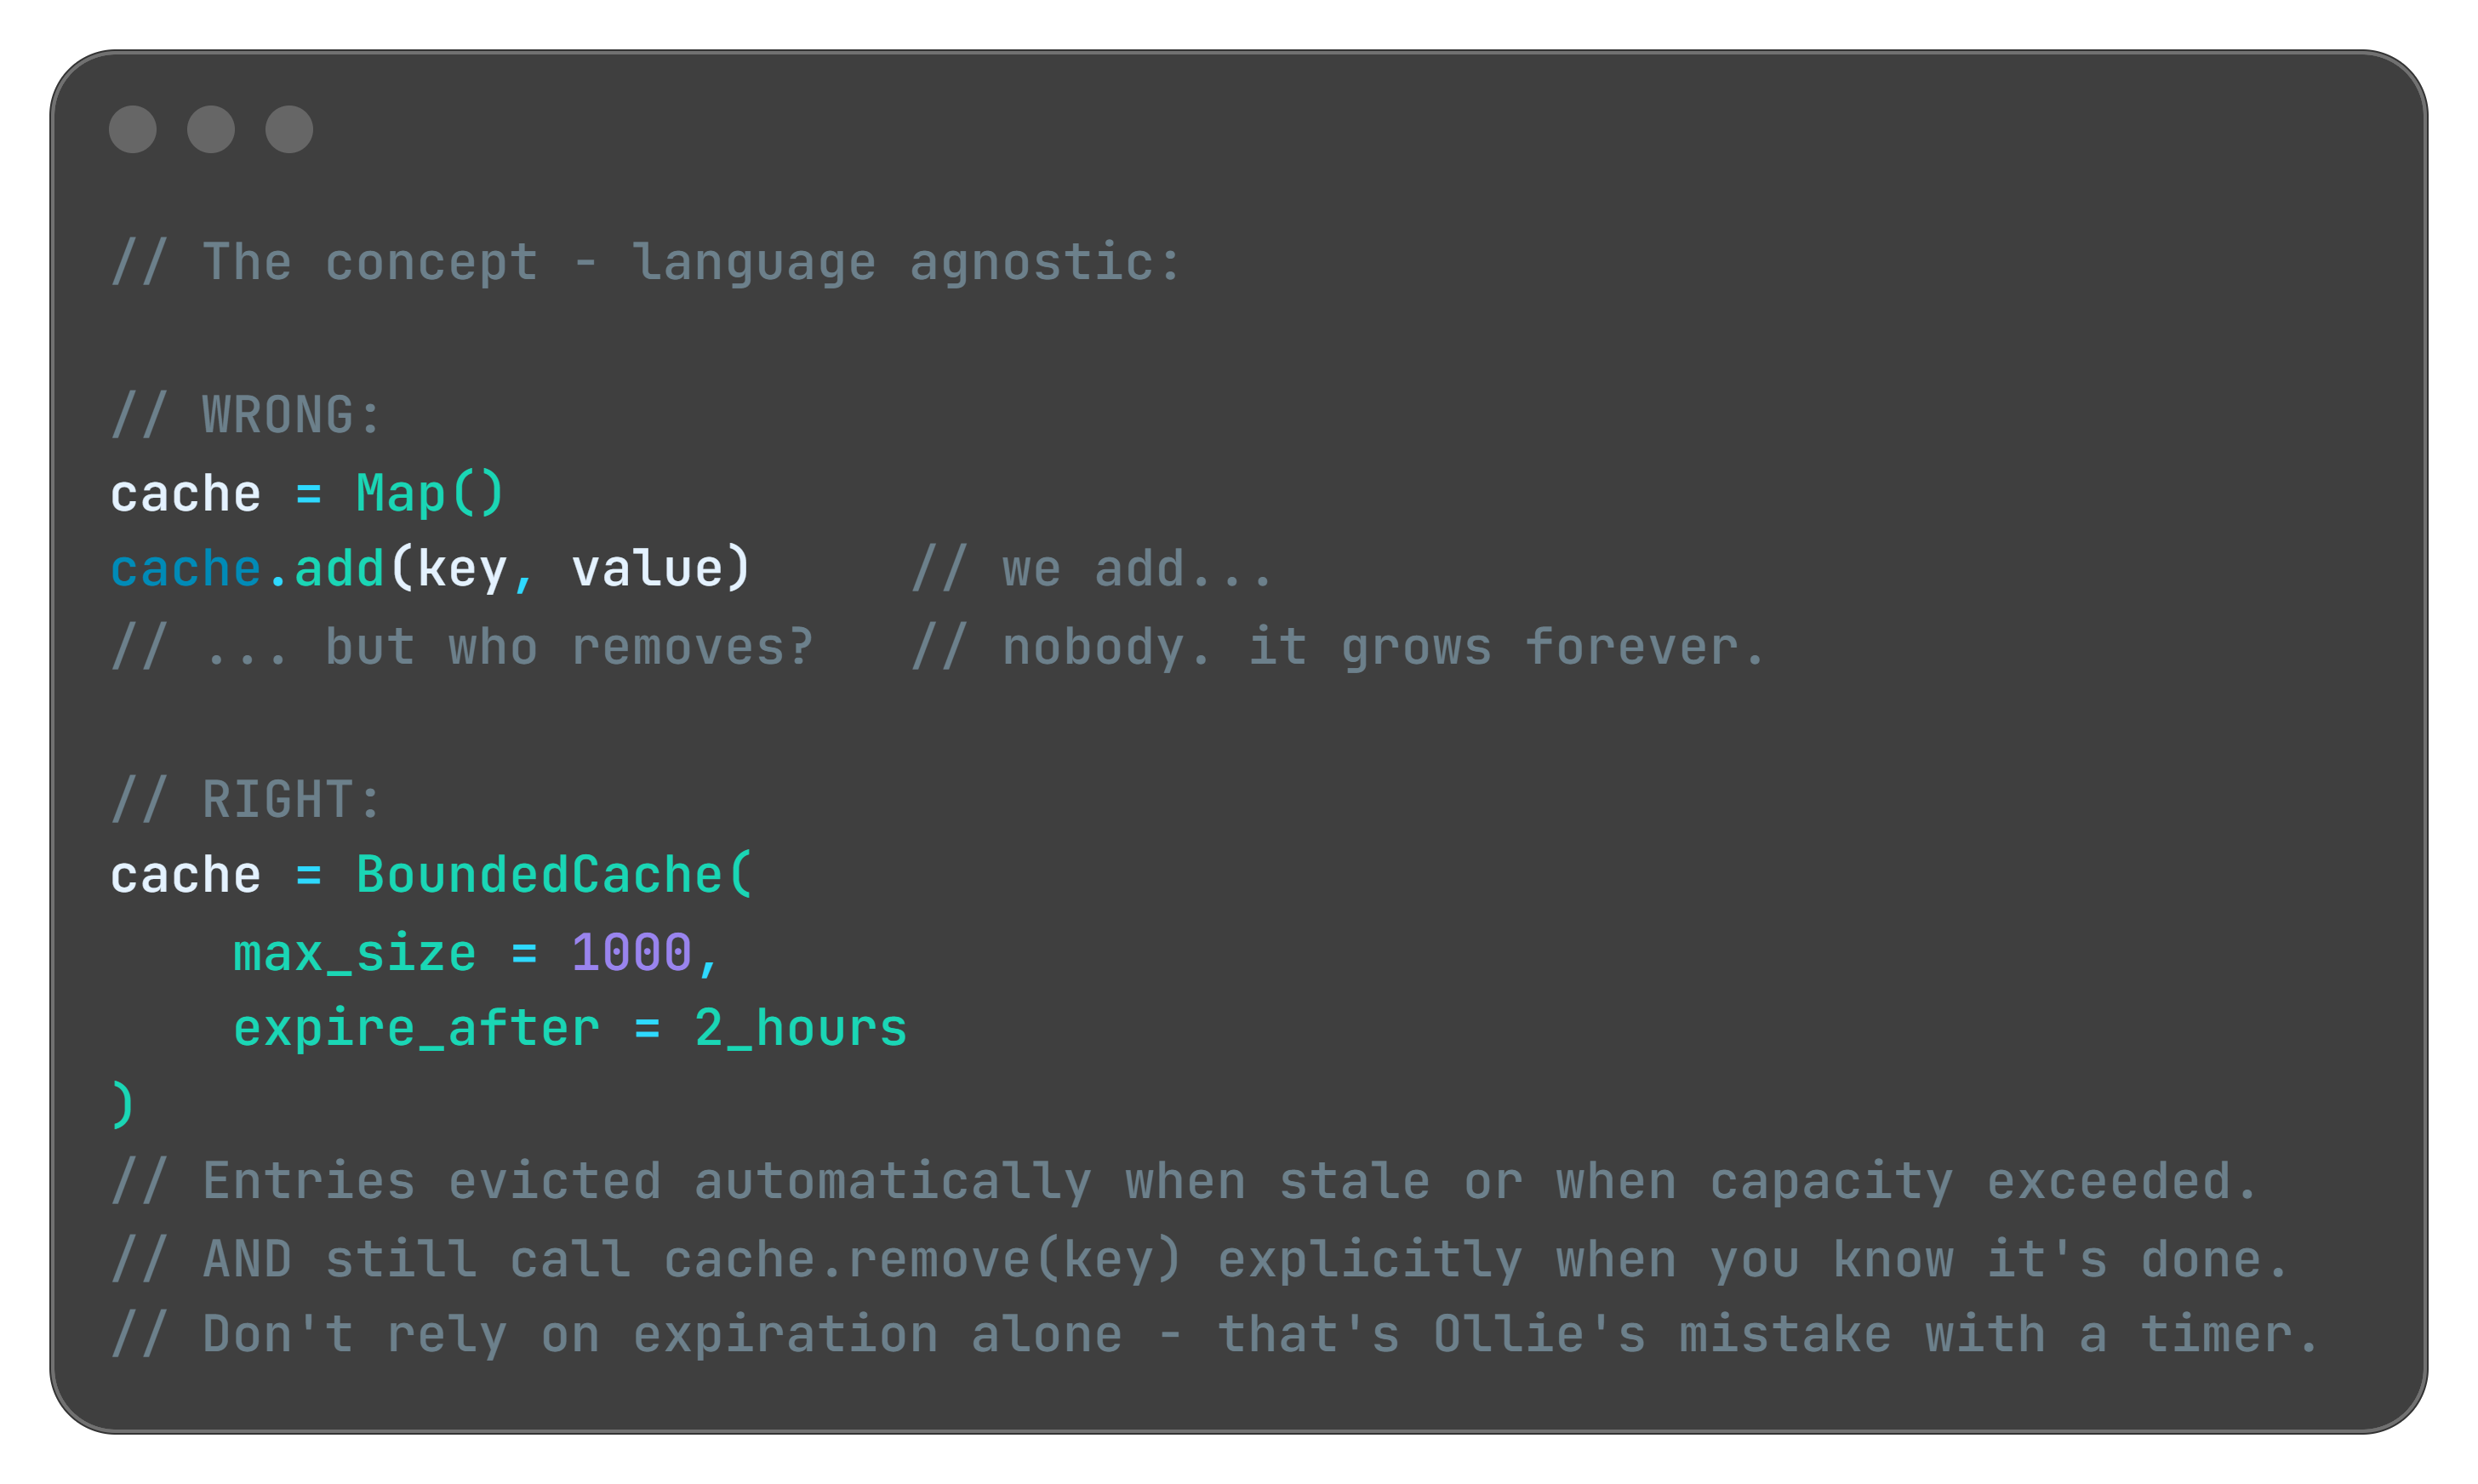
For collection-based leaks (the Ghost Tables scenario) the fix is using the right data structure. A plain map or list with no eviction policy is a ghost table factory. Use a bounded cache with explicit expiration instead:
Every major ecosystem has this: Guava Cache in Java, MemoryCache with size limits in .NET, cachetools in Python, lru-cache in Node.js.
Strategy 4: Weak References - The “Take It If You Need It” Pattern
Sometimes you want to cache something but you’re okay with losing it under memory pressure. Every major language has a construct for this:
Java:
WeakReference/SoftReference.NET:
WeakReference<T>Python:
weakref.ref()JavaScript:
WeakMap/WeakSet
The concept is the same everywhere: you’re telling the memory manager “I’m holding this, but if you need the space, take it. I’ll reload it if I need it again.”
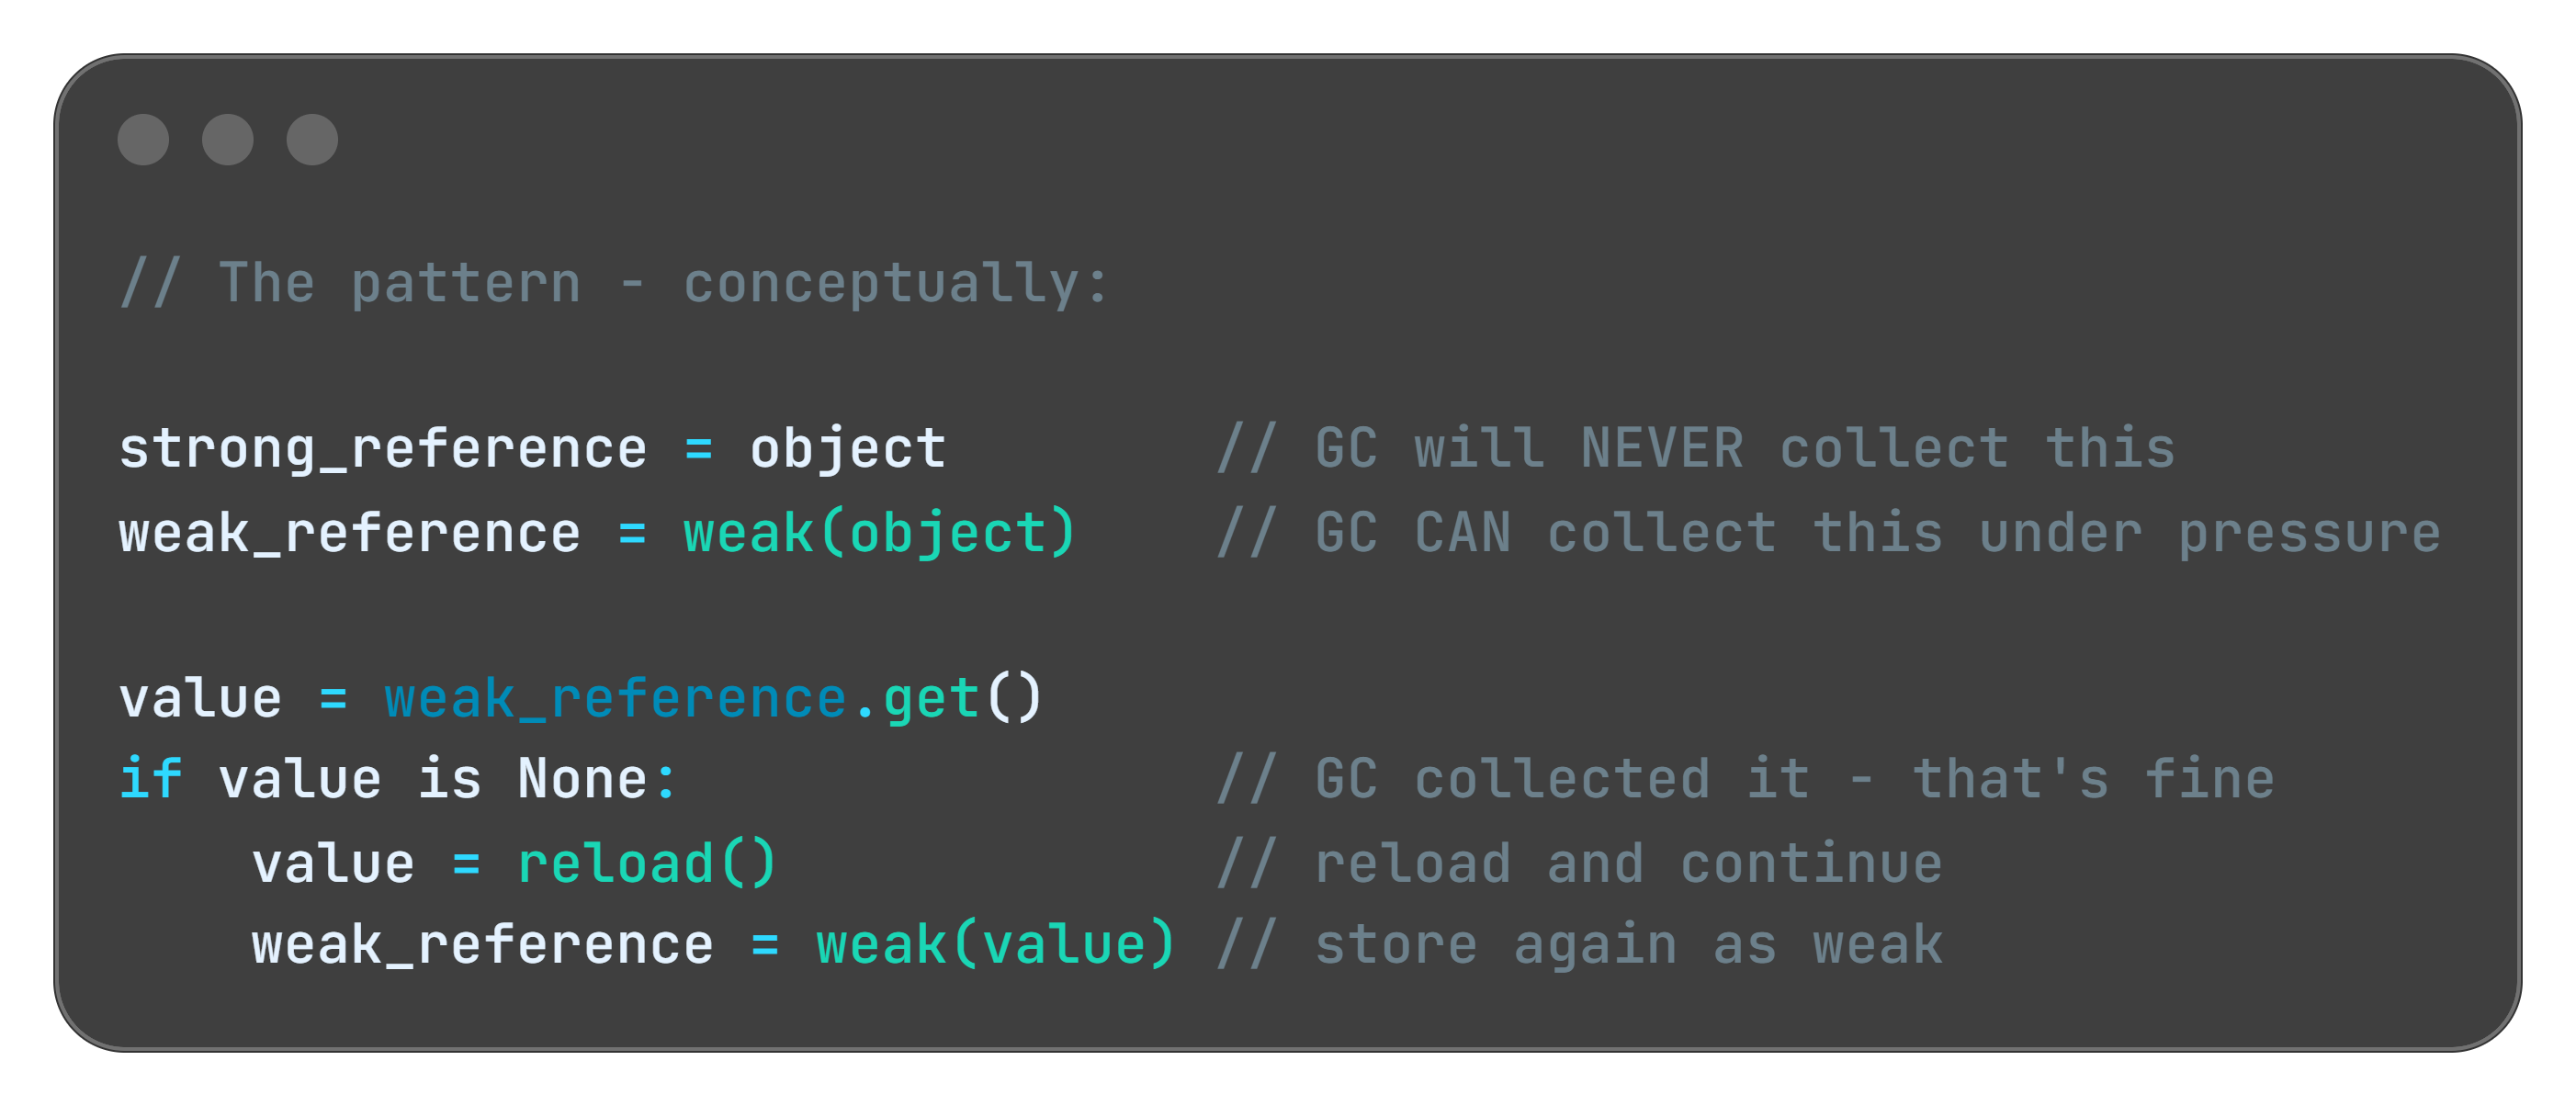
This is the right tool for image caches, computed results, and large objects that are expensive to create but not critical to keep. The cache helps performance when memory is available. It doesn't block the GC when memory is scarce.
Quick tips:
🔧 Production Pattern: Add heap trend metrics to your standard monitoring. Alert when the 24-hour slope of heap usage exceeds a threshold - not just when absolute usage spikes. A leak that takes 3 days to crash you won’t trigger a “heap at 90%” alert until it’s too late to investigate calmly.
💼 Business Decision Alert: Memory leak fixes are unglamorous and rarely make release notes. But systems that silently degrade over days erode user trust faster than single-crash incidents. Observability tooling is not optional infrastructure.
My Personal Reflection on Memory Leaks
I live this pattern every weekend.
My kids have a toy box. The rule is simple: when you take a toy out, you put it back when you’re done. Clean contract. Explicit lifecycle. Works perfectly in theory.
In practice? The toy comes out. Gets used for twelve minutes. Gets abandoned on the floor. A new toy comes out. The first one is forgotten - but it’s still there, occupying space, waiting for a cleanup that never comes. By Sunday evening the living room is at capacity. You can’t move without stepping on something. New toys can’t come out because there’s no floor space left.
Nobody maliciously hoarded the toys. Each individual “I’ll put it back later” seemed reasonable in the moment. The accumulation was invisible until suddenly it wasn’t.
This is exactly how memory leaks feel in production. No single allocation was wrong. No single “I’ll release this later” seemed dangerous. But three weeks into the deployment, your service is at 4GB and slowing down, and somewhere in the heap there are thousands of objects that finished their job days ago and nobody told them to go home.
The fix at home is the same as in code: you don’t wait until the floor is full. You build the habit of putting things back as part of finishing the task, not as a separate cleanup step you’ll do later.
Later never comes. In parenting and in software.
P.S.: That fix is still quite hard to apply with my kids! That’s why I always enter the kids room with slippers on… hate those “leaked” lego blocks.
Edge Cases: When the Leak Isn’t Where You Think
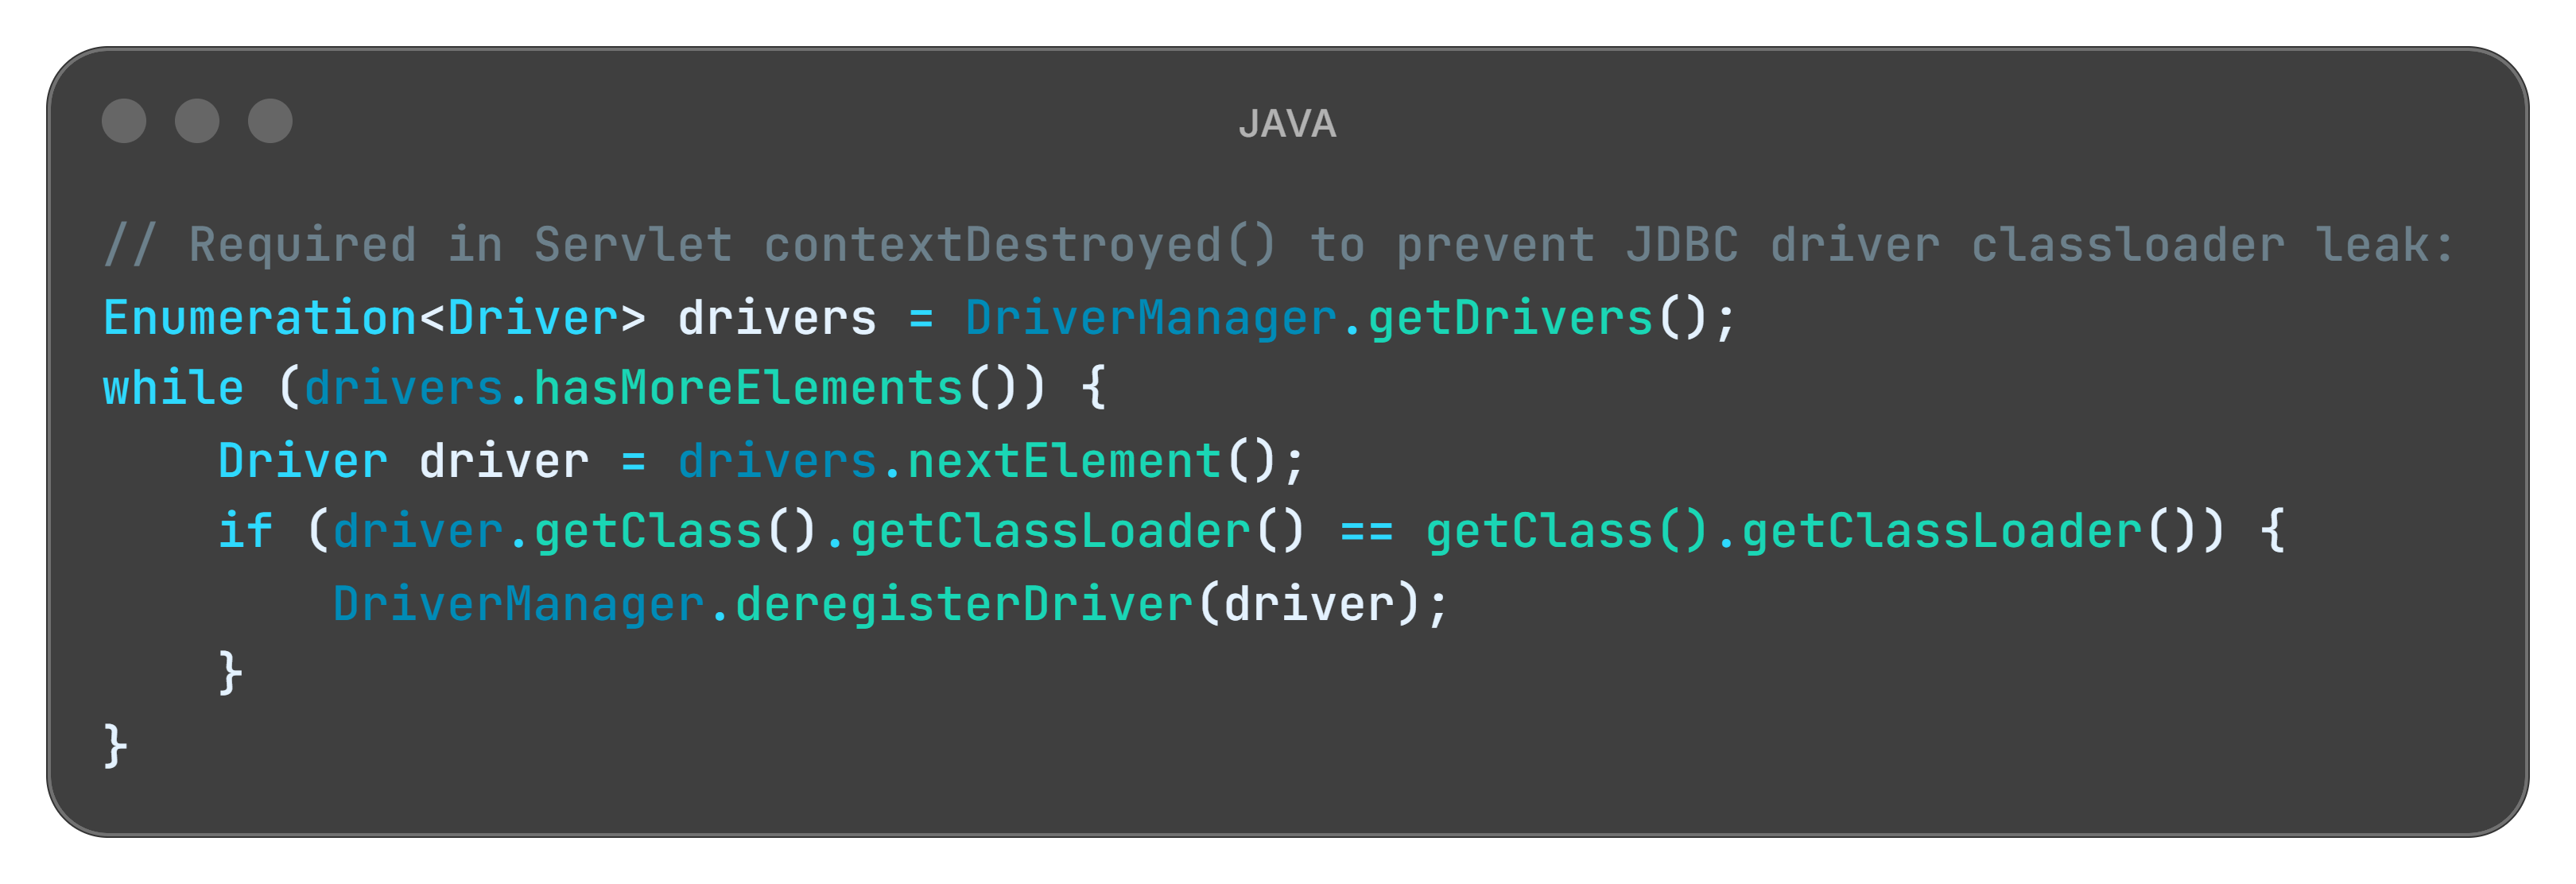
The Classloader Leak (Java’s hidden trap)
In Java EE and Spring applications, hot deployments can cause classloader leaks. When you redeploy, the old classloader should be garbage collected. But if any static field, thread local, or external library holds a reference to a class from the old classloader, the entire old classloader - and all the classes it loaded - stay in memory. Redeploy ten times and you’ve effectively loaded your application into memory ten times simultaneously.
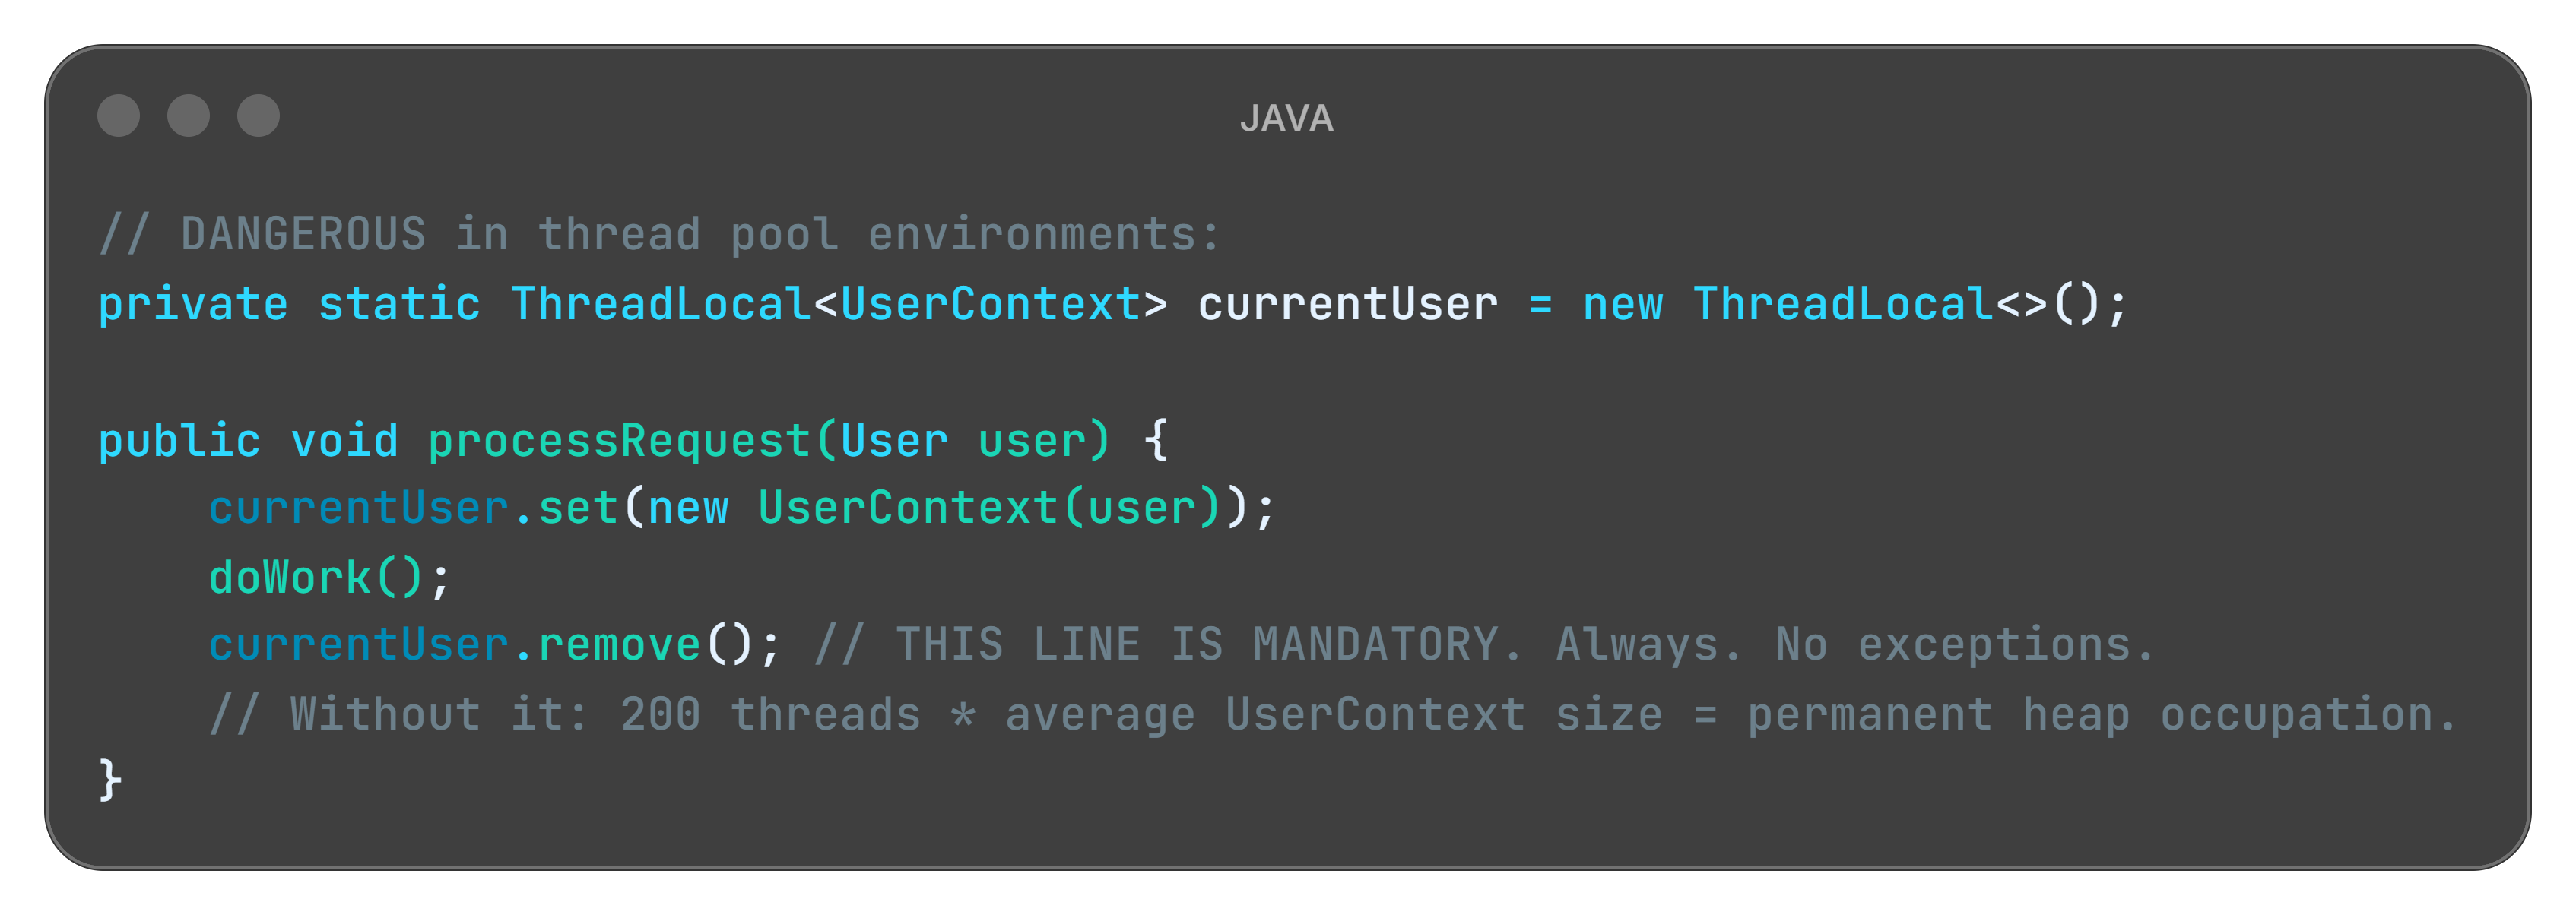
The ThreadLocal Time Bomb
ThreadLocal stores data per-thread. In application servers, threads are pooled and reused across requests. If you store an object in ThreadLocal during a request and never remove it, every thread in the pool carries that object for the entire server lifetime.
Quick tips:
👨💻 Engineers: Add heap object count trending to your monitoring today - not just heap size. jmap -histo <pid> every 30 minutes for 2 hours tells you more about a leak than any dashboard. If a class count keeps climbing without plateauing, you’ve found your ghost table.
👔 Tech Leads: Add one question to your definition of done: “Who releases this resource, and in which code path?” If the answer is “the GC eventually” - the ticket isn’t done. Explicit lifecycle ownership is an architectural decision, not a cleanup detail.
💼 Managers: Ask your team: “Do any of our services require a restart to reclaim performance?” If yes - that’s not maintenance. That’s a masked incident running on a schedule. The restart is hiding the leak, not fixing it.
Famous Failures - Real crashes. Real lessons.
Firefox (2012-2016): The “Add-on Graveyard”
For years, Firefox had a memory reputation that became a cultural meme. Power users who kept the browser open for days watched it climb past 1GB, then 2GB, eventually forcing a restart just to reclaim a usable machine.
The root cause wasn’t a single bug - it was a systemic pattern across the extension architecture. Add-ons registered event listeners on DOM elements and browser events. When tabs were closed or pages navigated away, the DOM was destroyed, but the listener registrations in extension code remained. Each closed tab left behind a cluster of references that held entire DOM trees - images, scripts, CSS, layout objects - in heap memory long after the tab was gone.
Mozilla spent years tracking these leaks down category by category. The about:memory diagnostic page was built specifically to expose them. Full resolution came only with the shift to WebExtensions and the redesigned isolation model in Firefox Quantum (version 57) in 2017.
The damage: Years of market share lost to Chrome, which avoided the problem structurally from the start through per-tab process isolation - an architectural decision that significantly reduced the impact of extension-caused leaks.
Lesson learned: When you expose an event system to third-party developers, you’re also handing them the ability to leak indefinitely. Your cleanup contract is only as strong as your weakest extension point.
Read more: https://blog.mozilla.org/nnethercote/2012/07/19/firefox-15-plugs-the-add-on-leaks/
Quick tips:
👨💼 For Your Next Board Meeting: “We restart every weekend for maintenance” is not a maintenance procedure. It’s a masked incident. The question worth asking your CTO: do we know what’s accumulating in memory between restarts? If the answer is no, that’s the investigation to fund.
👨🏫 Teaching Moment: Add “who owns cleanup?” as a required question in your next architecture review for every new resource type introduced. Object lifecycle diagrams are not optional for systems that run continuously for weeks. Ten minutes of whiteboarding saves one Friday night incident.
Slack (2017): The “One App Per Workspace” Problem
Slack’s desktop client ran each workspace in its own separate webview - essentially a full browser instance per team. A user signed into three workspaces was running three complete JavaScript applications simultaneously, each maintaining its own DOM, its own state, its own memory budget.
A single workspace consumed between 130MB and 960MB depending on activity. For users in multiple large enterprise workspaces, the client routinely exceeded 2-3GB with no mechanism to reclaim memory from backgrounded teams.
The damage: “Slack is eating my RAM” became a standing complaint in developer communities, contributing to the rise of alternatives positioning lightweight memory usage as a primary feature.
The fix required a fundamental architectural change - a lightweight “slim client” for backgrounded workspaces that maintained presence and notifications without holding the full application state in memory.
Lesson learned: Architectural decisions made early become memory budgets later. “One process per X” scales linearly with X. Know your multiplier before you ship.
Read more: https://slack.engineering/reducing-slacks-memory-footprint/
Android (Ongoing): The Bitmap Swamp
Mobile developers know this pattern intimately. Loading images in Android creates Bitmap objects on the heap. A single full-resolution photo can consume 8-32MB. Load several without releasing the previous ones and you’ve burned your entire heap budget on three screens of navigation.
The root cause was almost always identical: developers loaded bitmaps into ImageView components, navigated to a new screen, but the previous Activity held onto the bitmap through a callback, a static field in a list adapter, or a context reference. The bitmap couldn’t be GC’d. On devices with limited heap budgets on early Android hardware, this crashed in minutes of typical use.
Libraries like Glide and Picasso exist primarily to solve this exact problem. They manage bitmap lifecycle automatically, using weak references and LRU eviction aligned with Android’s Activity lifecycle. The existence of two major libraries dedicated entirely to image memory management tells you something about how often the default approach was wrong.
The damage: App crashes drove one-star reviews across the early Android ecosystem. Entire categories of image-heavy apps had poor reputations not because of logic bugs, but because of bitmap leaks.
Lesson learned: When your framework gives you a lifecycle - Activity, Fragment, View - tie your resource cleanup to it explicitly. Don’t invent your own.
Read more: https://developer.android.com/topic/performance/graphics/manage-memory
Key Takeaways
The CEO-Digestible Recipe
Serve technology terms as digestible dishes to your CEO:
♨ Memory Leak - The restaurant has tables the system shows as occupied, but the guests left hours ago. New bookings get rejected. The dining room is empty. The system is convinced it’s full.
♨ Heap - The restaurant warehouse. Large storage space for everything the system is actively working with. The longer it accumulates unreleased objects, the less space is available for new work.
♨ Garbage Collector - The overnight cleaning crew. They clear everything that has no active references. The catch: they only clear tables that have been marked available. If the manifest still says occupied, they walk right past it.
♨ Object Reference - The entry on the tablet that says “Table 4 is occupied.” As long as that entry exists, the cleanup crew won’t touch Table 4. Delete the entry, and they can clean it.
♨ WeakReference - A sticky note that says “I’m using this, but if you urgently need the space, take it.” The GC can reclaim it under memory pressure without asking permission. Useful for optional caches.
♨ Heap Dump - A full snapshot of the warehouse at a specific moment. You compare two snapshots taken hours apart to find which boxes keep accumulating without ever leaving.
♨ Memory Profiler - Bill checking the timestamps on the tablet entries. Which tables have been “occupied” since yesterday? Those are your ghost tables. That’s where you start.
♨ Resource Lifecycle - The complete story of an object: who creates it, who uses it, and who is responsible for releasing it when it’s done. Every resource needs all three questions answered before you ship.
The Three Rules of Memory Leaks (Remember These)
1. Cleanup is a feature, not an afterthought
Every resource you allocate needs an explicit owner responsible for releasing it. “The GC will handle it” is only true if no references remain. Make cleanup as deliberate as initialization. Document who cleans what.
2. Leaks are slow and sneaky by nature
They won’t crash your system on Monday. They’ll crash it on Thursday. The gradual-degradation-healed-by-restart pattern is the most commonly missed signal in production. Instrument your heap trend over time, not just your current usage.
3. Follow the reference chain, not the object
When debugging, don’t ask “where is this object?” Ask “who is still holding a reference to it, and why?” Heap profilers show you reference chains. Follow the chain to its root. That’s where the fix lives.
For Engineers
Start here when you see gradual degradation:
Service slows over 24-48h, restarts fix it -> heap trend graph + object count comparison between two heap dumps taken 30 minutes apart
OutOfMemoryError after days of uptime -> add
-XX:+HeapDumpOnOutOfMemoryErrorflag, analyze top object type growthThread pool exhausted in app server -> audit all
ThreadLocalusages, verify.remove()is called in all code paths
Metrics worth tracking: heap used trend over 24h and 7d (not just current value), object creation rate vs GC reclaim rate, connection pool active/idle ratio over time, top 10 object types by instance count (not size) in weekly snapshots.
Tools: Eclipse Memory Analyzer (MAT) and VisualVM for Java. dotMemory for .NET. Chrome DevTools Memory tab for JavaScript/Node.js.
For Tech Leads
Five questions to add to every design review involving new resources:
Who creates this resource?
Who uses it, and for how long?
Who is explicitly responsible for releasing it?
What happens if the release path fails (exception, timeout, crash)?
How will we detect if instances are accumulating in production?
Team practice: Add “object lifecycle diagram” to your definition of done for features introducing new long-lived objects, caches, or subscriptions. Ten minutes of whiteboarding. It’s cheaper than an incident.
Code review habit: For every object creation involving connections, collections, or event subscriptions - trace whether a corresponding release exists in all code paths, including error paths. If you can’t find it, the review isn’t done.
For Managers
Memory leaks are the closest thing software has to a slow gas leak in a building. Nothing explodes immediately. Performance degrades invisibly. The team restarts the service and calls it maintenance. The gas keeps leaking.
Questions to ask your CTO:
Do we know the memory trend of our critical services over the past 30 days?
Do we have alerting on gradual heap growth, or only on crashes?
When was the last time a memory profiler was run against a production-representative load?
ROI framing: A memory leak that causes 2 hours of degraded performance during peak traffic costs more in lost revenue and support overhead than a year of profiling tool licenses. Instrument the trend. Don’t wait for the crash.
Bonus content: download the episode comic:
Miro: Sorry, but these are still in the oven. Will take some time to prepare them due to some nasty memory leak I am struggling with.
Perfect for: Presentations, onboarding docs, tech talks
Using it? Reply and tell me!
Close Time
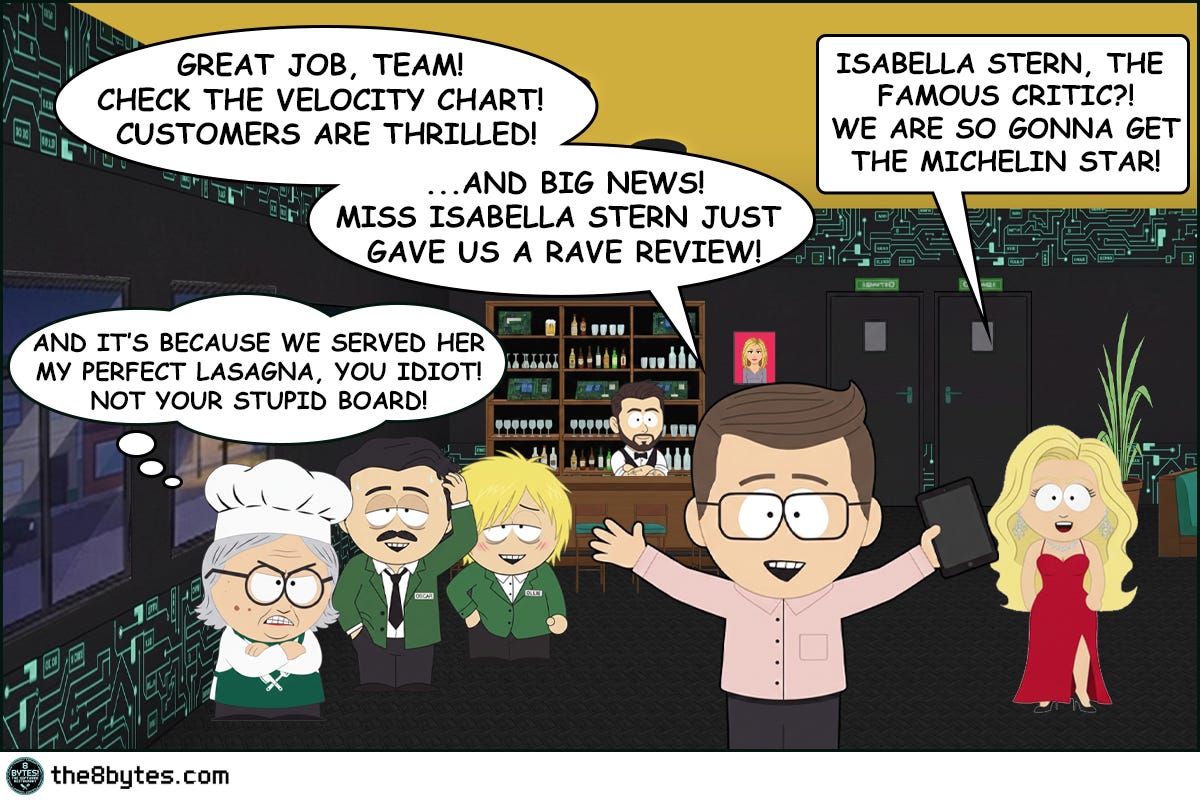
Cody, the bartender: “Bill was proud. And he had every reason to be. The first sprint was clean. The Kanban board performed. And Isabella Stern, the most feared restaurant critic in the city, had not only stayed for dessert, but wrote about it in the newspaper.
What Bill forgot? A system only works if every step is completed - immediately, as it happens. Not later. Not after the shift. Not tomorrow. Later never comes.
Todo. In Progress. Done. All three. Every time. On the second.
Unreleased tables become ghosts. Enough ghosts and the system thinks it’s full. In software, we call this a memory leak. In Bill’s restaurant, we call it a very bad morning.
Cheers.”
Episode 7 Drops in Two Weeks
In s01e07 “The Double-Booked Steak”:
Two VIP guests. One steak left in the freezer. Two waiters fighting for it!
Literaly!
In software, we call this a race condition. In the restaurant, we call it a very expensive argument.
Your Feedback Matters
What worked for you? What didn’t? Was the Ghost Tables metaphor clear?
Your feedback shapes future episodes. Comment below 👇
Know a developer who's been blaming "random restarts" on infrastructure? A tech lead who's never run a heap profiler? A manager whose team says "we just restart it every Sunday"?
Illustration credits: Comic scenes conceptualized by 8bytes! and rendered by Nano Banana.